Manage all of your projects in one place.
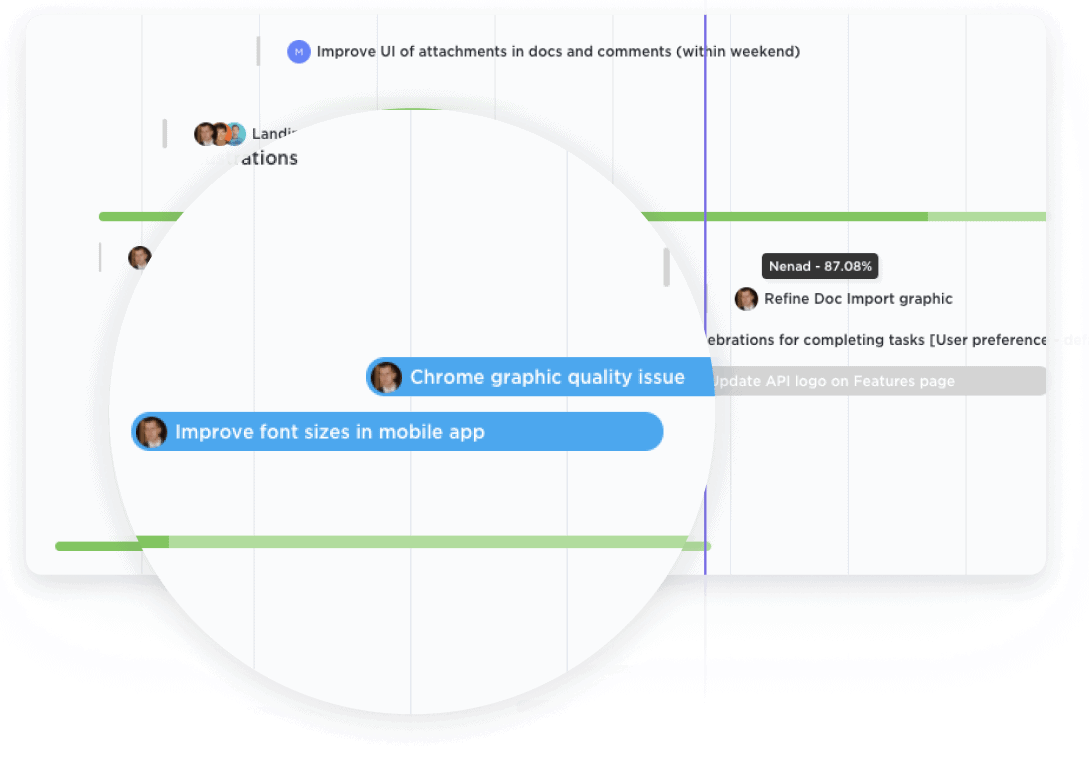
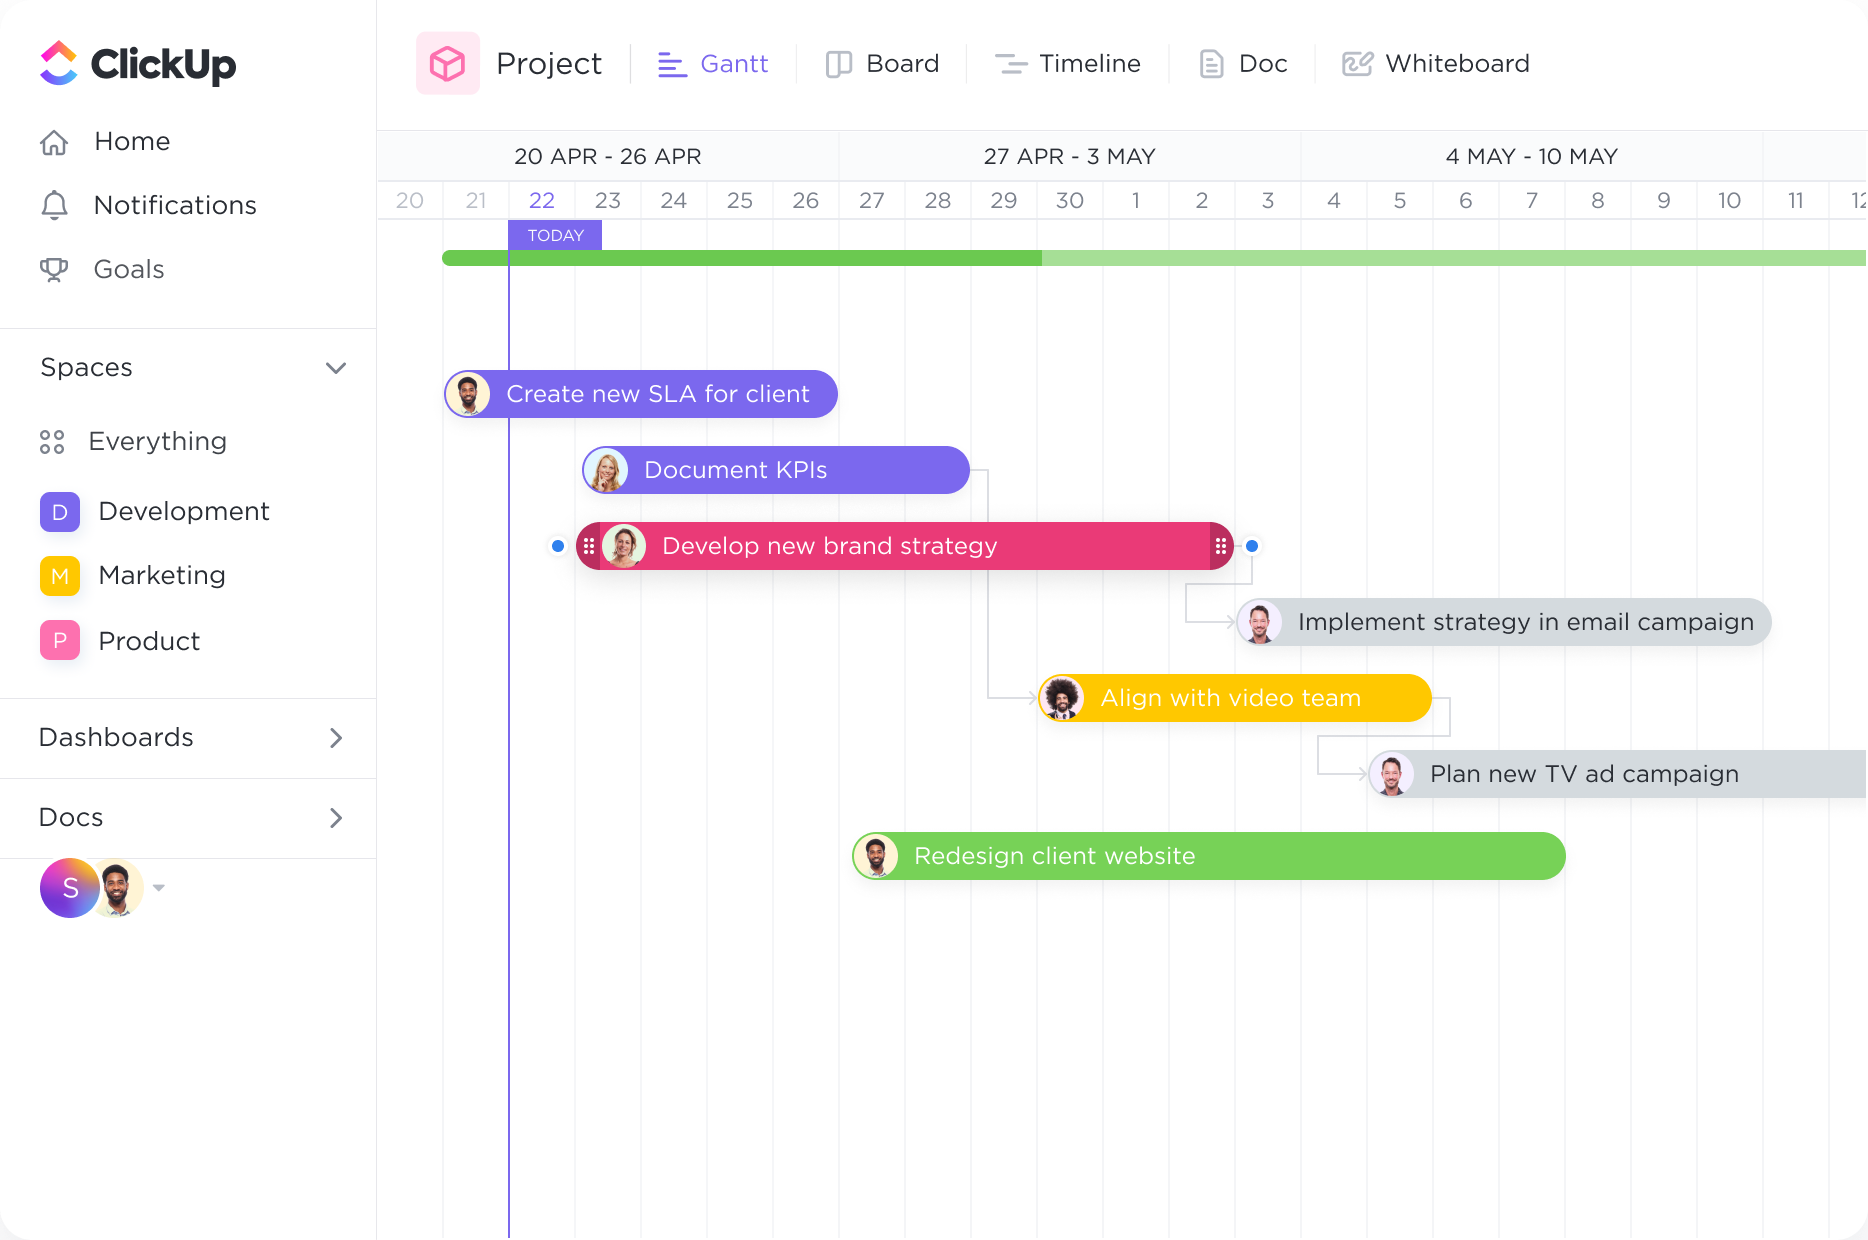
Get a bird's-eye view of all Spaces, Projects, Lists, and tasks in one Gantt chart. With clear coloring options, you can easily see what work is happening and where.

Streamline your research projects with ClickUp's Gantt Chart software. Plan, organize, and track your research tasks with ease using our intuitive and user-friendly interface. Boost productivity, manage deadlines, and collaborate seamlessly with your team, all in one platform. Take control of your research projects and achieve success with ClickUp's Gantt Chart software.
Free forever.
No credit card.

Trusted by the world’s leading businesses
Get a bird's-eye view of all Spaces, Projects, Lists, and tasks in one Gantt chart. With clear coloring options, you can easily see what work is happening and where.

With the Gantt chart's dynamic timeline, you can easily schedule tasks, keep up with project progress, manage deadlines, and handle bottlenecks.
Planning and scheduling are critical components of academic research. A Gantt chart offers a visual outline of the project divided into manageable phases such as literature review, methodology, data collection, analysis, and writing. This setup aids in setting realistic timelines, highlighting key milestones, and promoting punctual progress throughout the research journey.
Academic research often involves collaboration among multiple individuals. By leveraging a Gantt chart, tasks can be specifically assigned to team members, delineating clear roles and responsibilities. This facilitates efficient workload distribution, fosters accountability, and supports synchronous progress, ultimately contributing to a streamlined collaborative effort.
Effective management of resources and equipment is crucial, especially in resource-intensive research projects. Gantt charts aid in the careful scheduling of such assets, helping to prevent overlaps in usage and ensuring accessibility when needed. By doing so, they help avoid potential delays and contribute to the meticulous execution of the research plan.
Academic research projects often operate under tight deadlines and require adherence to various milestones. Incorporating these milestones and deadlines within a Gantt chart ensures that all team members are cognizant of these critical dates. This approach encourages timely decision-making and task prioritization, aligning project objectives with scheduled timelines.
Research projects are dynamic, with progress and challenges that may necessitate adjustments to initial plans. Updating the Gantt chart to reflect real-time progress allows for the agile adaptation of timelines and tasks. This fluidity enhances the project's resilience to delays and scope changes, ensuring a cohesive approach to achieving research goals.
Gantt chart software can help researchers by providing a visual representation of research tasks and timelines, allowing for better planning and organization. It enables the identification of dependencies and critical paths, ensuring efficient project scheduling. Additionally, it facilitates collaboration and communication among research team members, improving coordination and enhancing productivity.
Gantt chart software can help researchers manage their project timelines effectively by visually organizing and tracking tasks, milestones, and deadlines. It provides a clear overview of the project's progress, dependencies, and potential bottlenecks, allowing researchers to adjust their plans and resources accordingly. Additionally, it facilitates collaboration and communication among team members, ensuring efficient allocation of resources and timely completion of research tasks.
There are several Gantt chart software options available that are recommended for researchers, such as Microsoft Project, Smartsheet, and TeamGantt. These software offer features like task and resource management, timeline visualization, collaboration tools, and progress tracking, which are particularly useful for managing research projects effectively and efficiently.