Manage all of your projects in one place.
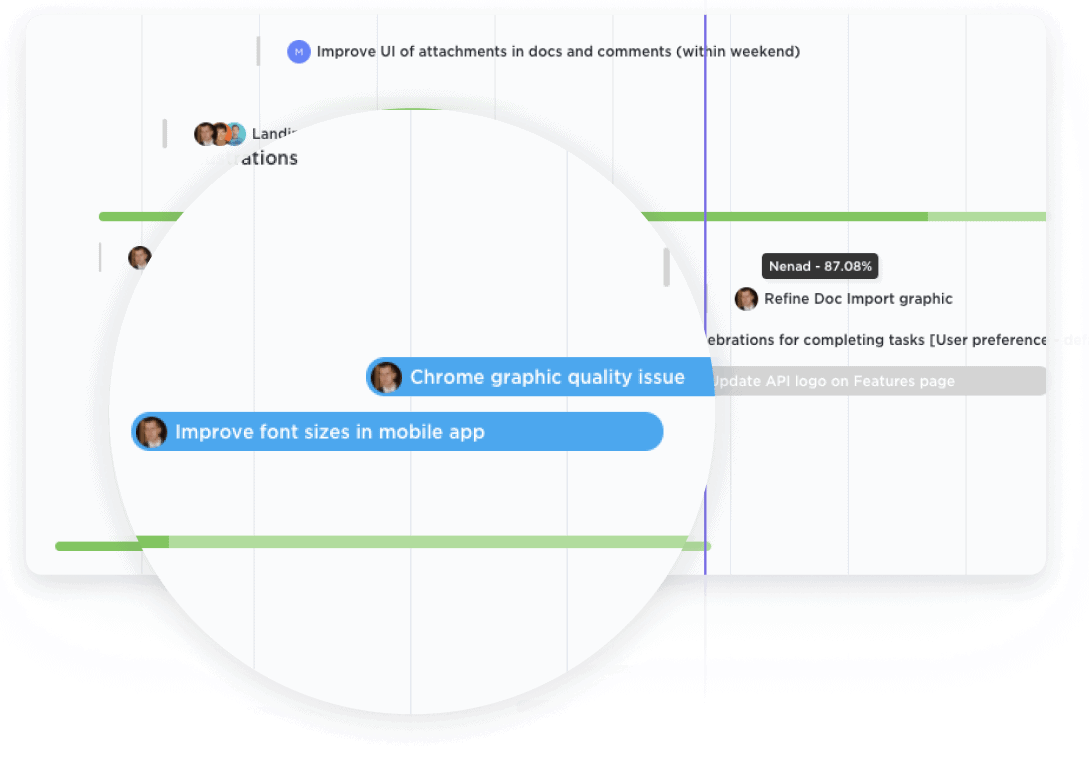
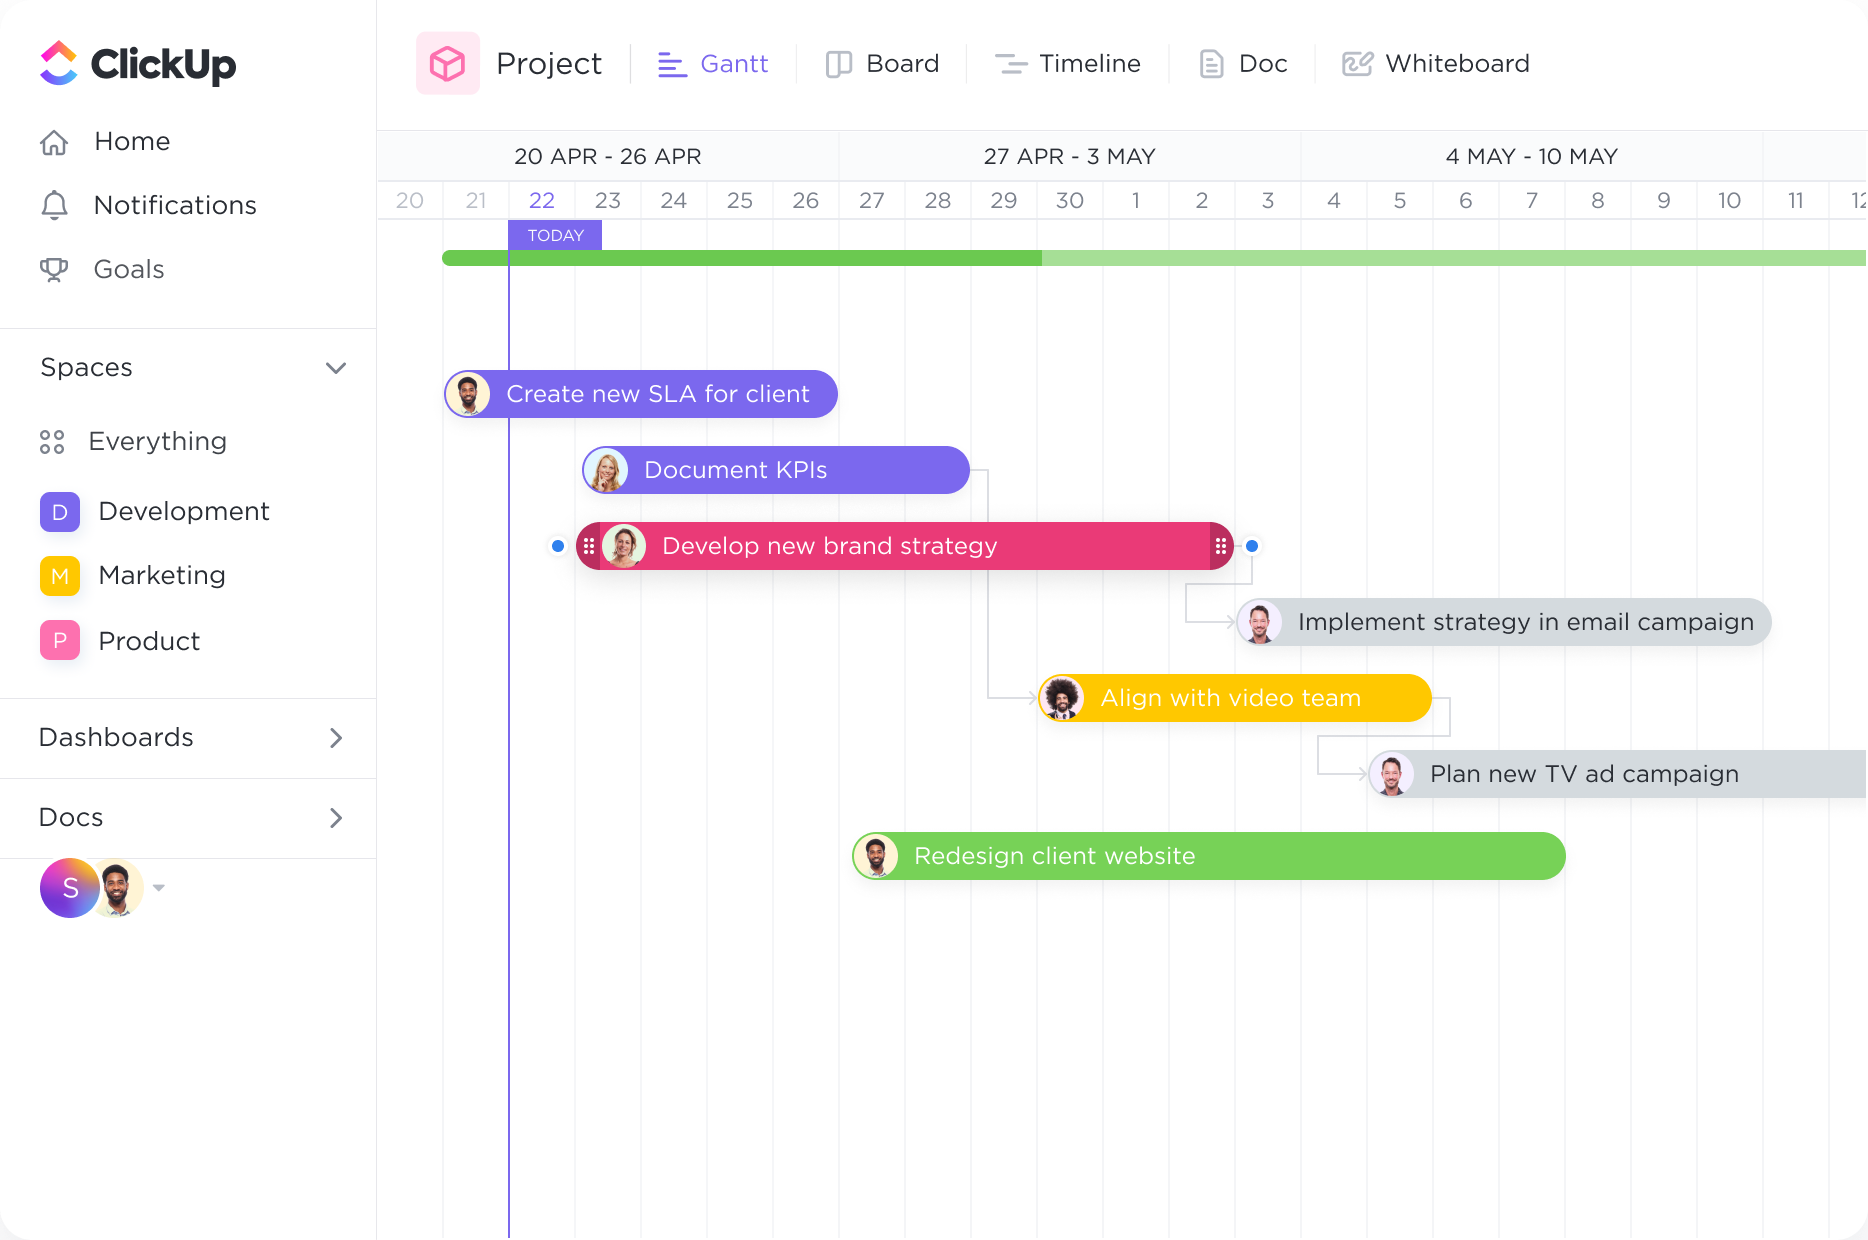
Get a bird's-eye view of all Spaces, Projects, Lists, and tasks in one Gantt chart. With clear coloring options, you can easily see what work is happening and where.

Streamline your quality control processes with ClickUp's powerful Gantt Chart software. Plan, track, and visualize your projects like never before with a user-friendly interface and customizable features. Seamlessly manage tasks, deadlines, and resources to ensure efficient and error-free workflows. Take control of your projects and elevate your quality control analysis with ClickUp's Gantt Chart software.
Free forever.
No credit card.

Trusted by the world’s leading businesses
Get a bird's-eye view of all Spaces, Projects, Lists, and tasks in one Gantt chart. With clear coloring options, you can easily see what work is happening and where.

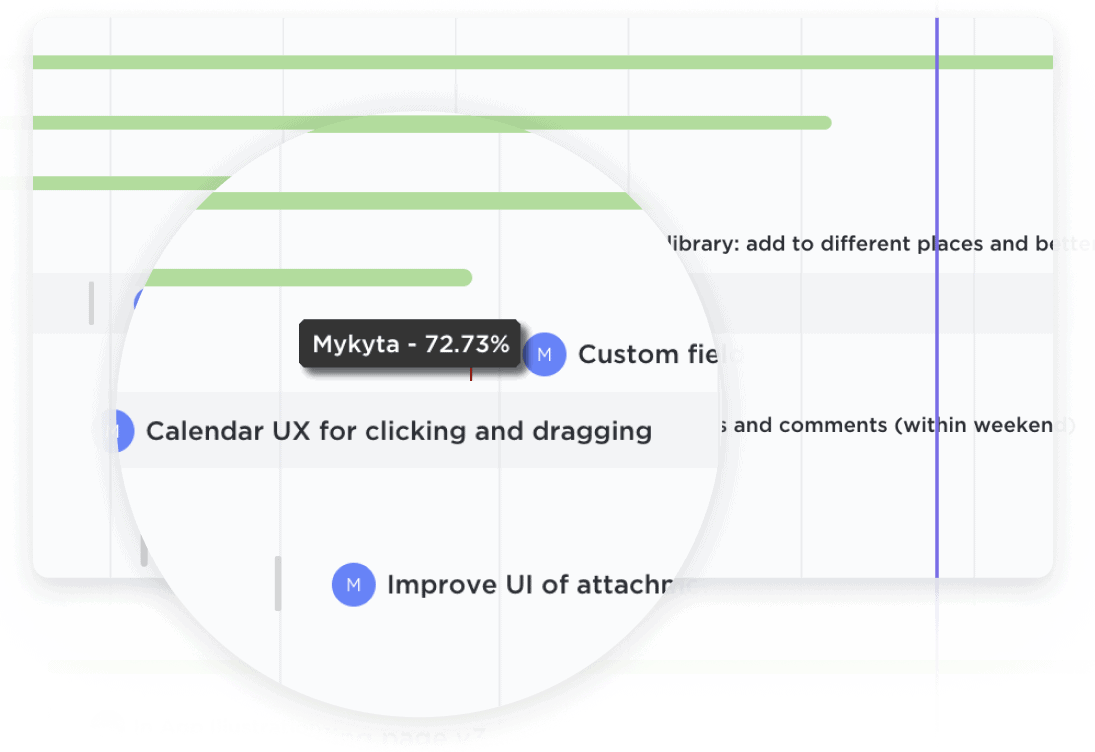
Easily update projects with a simple drag-and-drop action to collaborate amongst your team in real-time. Dynamic progress percentages provide a detailed snapshot.

Gantt charts can be incredibly useful for quality control analysts to manage and monitor the entire quality control process. By visualizing the various stages and tasks involved in quality control, analysts can easily track the progress, identify bottlenecks, and ensure that each step is completed within the designated timeframe. This helps in streamlining the quality control process and maintaining high standards throughout.
When it comes to quality control, tracking and resolving defects is of utmost importance. Gantt charts can be used to create a timeline for defect identification, analysis, and resolution. By assigning specific tasks to team members and setting deadlines, quality control analysts can effectively manage the defect resolution process and ensure that issues are addressed promptly, minimizing the impact on overall product quality.
Quality control analysts often have to juggle multiple projects and tasks simultaneously. Gantt charts provide a comprehensive overview of all ongoing quality control activities, allowing analysts to allocate resources efficiently and manage workloads effectively. By visualizing resource availability and task dependencies, analysts can optimize resource allocation, prevent overloading team members, and ensure that each project receives the necessary attention and resources.
Monitoring and reporting on the performance of quality control processes is crucial for continuous improvement. Gantt charts can be used to track key performance indicators (KPIs) and milestones, enabling quality control analysts to assess the effectiveness of their processes. By regularly updating the Gantt chart with relevant data and metrics, analysts can generate comprehensive reports that highlight areas of improvement, identify trends, and make data-driven decisions to enhance quality control practices.
Gantt chart software can help you in managing quality control projects effectively by providing a visual representation of project timelines, tasks, and dependencies. This allows you to track and monitor the progress of quality control activities, ensuring that tasks are completed on time and in the correct order. It also helps in identifying potential bottlenecks or delays, allowing you to take proactive measures to address them. Additionally, Gantt charts enable better coordination and communication among team members, leading to improved collaboration and efficiency in quality control efforts.
Yes, Gantt chart software can be used to track and monitor quality control tasks and milestones. It provides a visual representation of the project timeline, allowing you to allocate resources, set deadlines, and track progress. By integrating quality control tasks and milestones into the Gantt chart, you can easily identify potential bottlenecks, monitor task completion, and ensure that quality control activities are effectively implemented throughout the project.
Yes, Gantt chart software can be integrated with other quality control tools and systems to ensure seamless workflow management. Integration allows for the automatic transfer of data between systems, enabling real-time updates and synchronization of information. This integration enhances communication, streamlines processes, and provides a comprehensive overview of project progress, quality control measures, and potential bottlenecks, improving overall workflow management efficiency.