Manage all of your projects in one place.
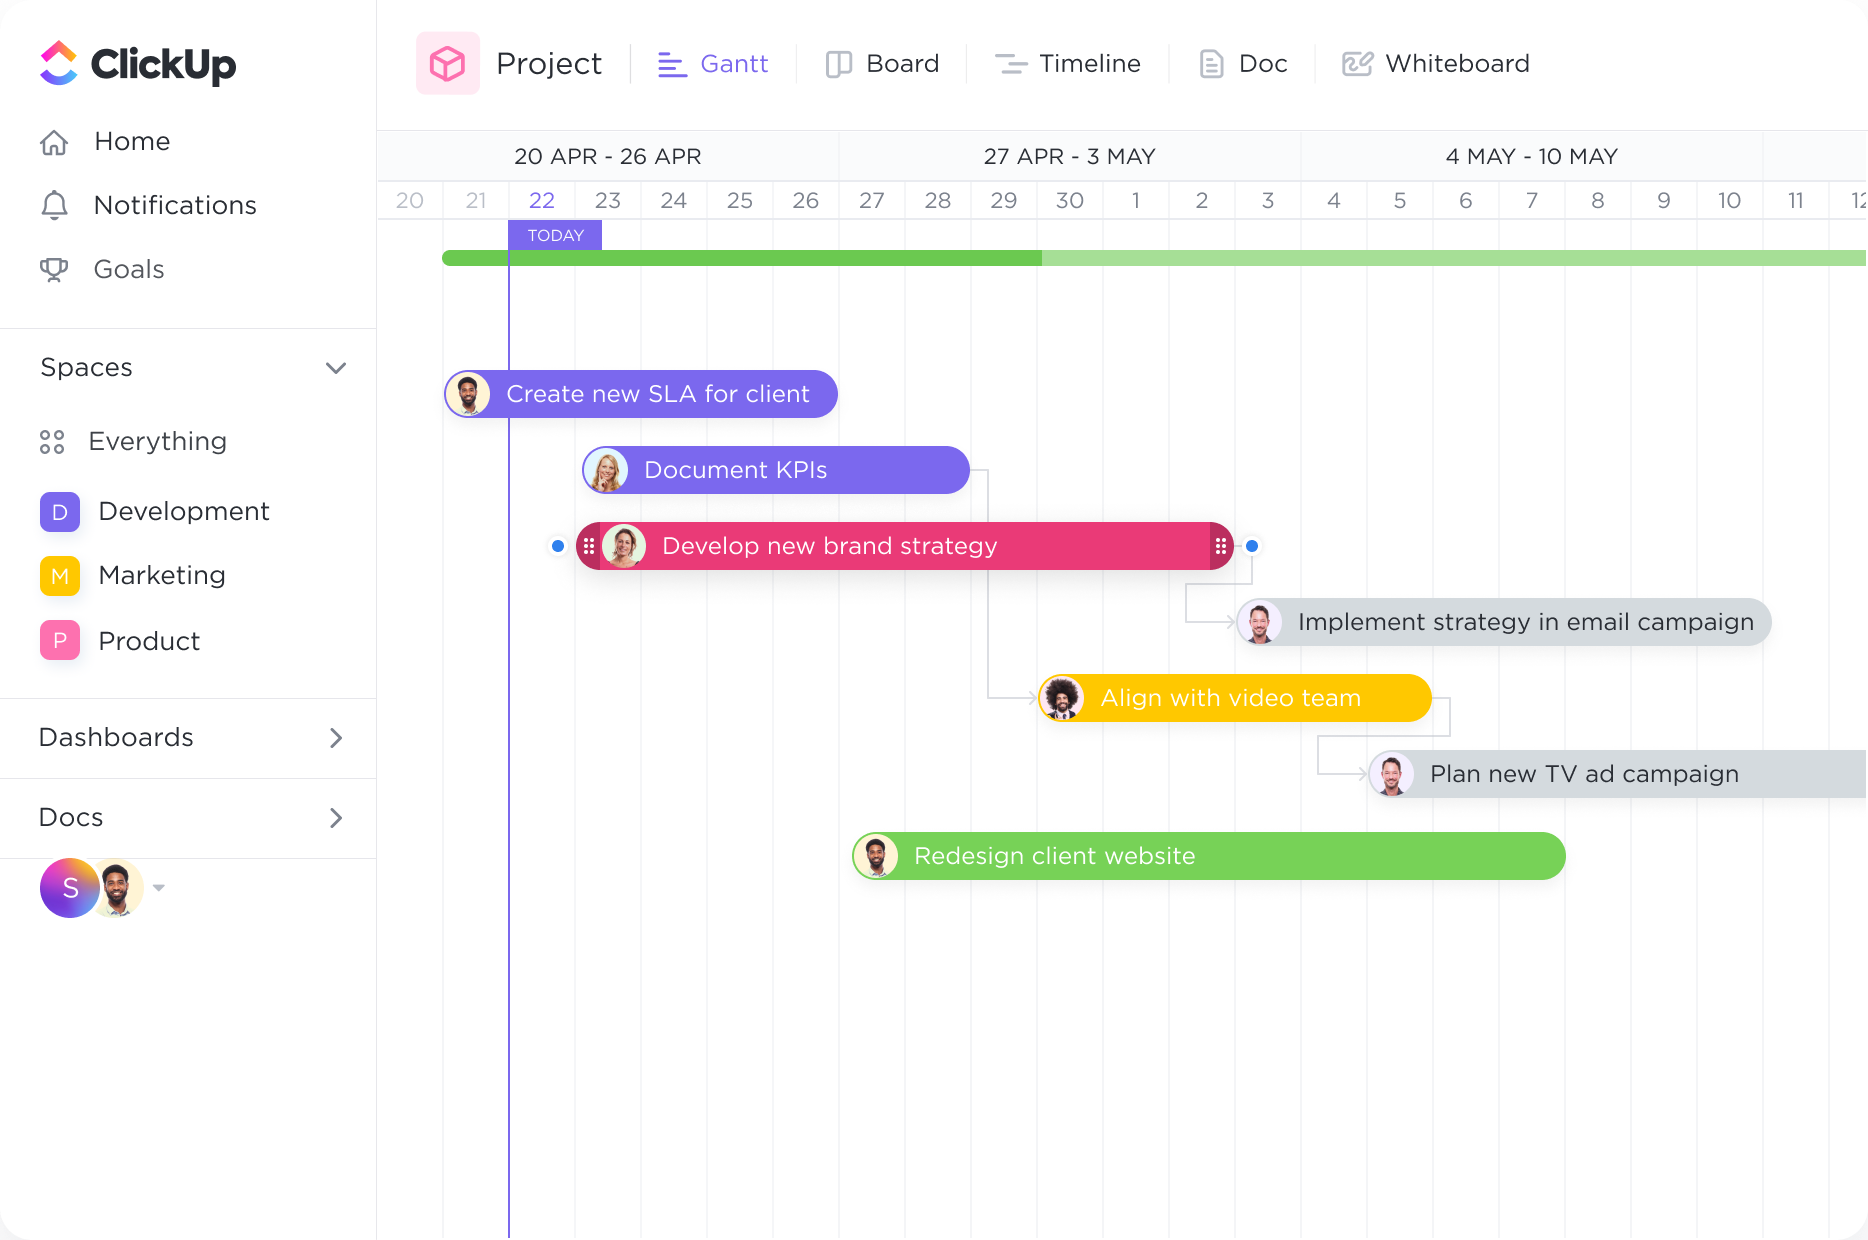
Get a bird's-eye view of all Spaces, Projects, Lists, and tasks in one Gantt chart. With clear coloring options, you can easily see what work is happening and where.

Supercharge your productivity and streamline your project management with ClickUp's Gantt Chart software. Create, organize, and track your tasks and deadlines effortlessly, all in one place. Perfect for professors, this intuitive tool allows you to easily plan and visualize your projects, ensuring smooth collaboration and efficient time management. Take control of your workload and stay on top of your academic pursuits with ClickUp's powerful Gantt Chart software.
Free forever.
No credit card.

Trusted by the world’s leading businesses
Get a bird's-eye view of all Spaces, Projects, Lists, and tasks in one Gantt chart. With clear coloring options, you can easily see what work is happening and where.

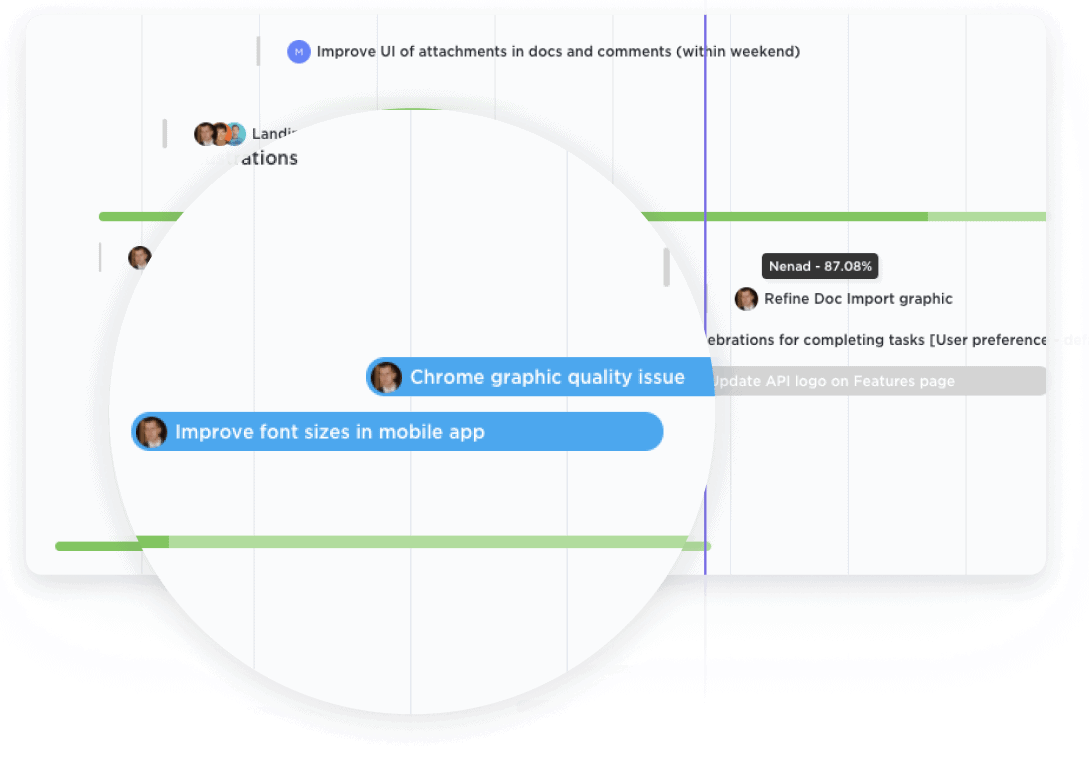
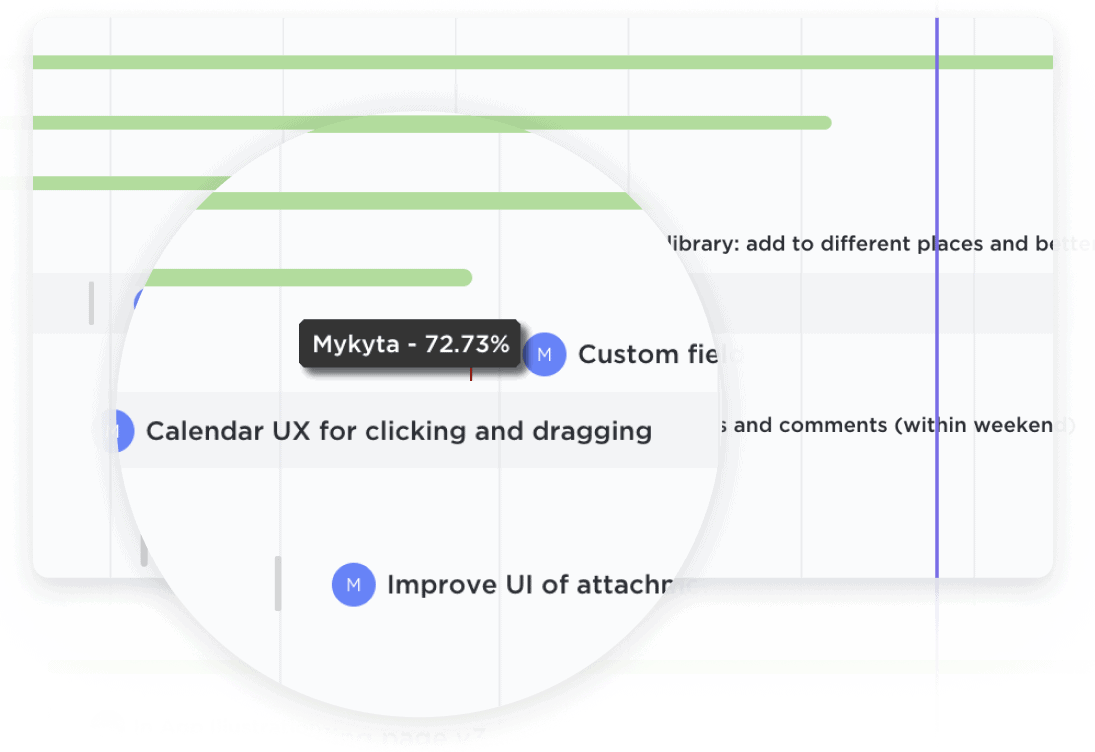
Easily update projects with a simple drag-and-drop action to collaborate amongst your team in real-time. Dynamic progress percentages provide a detailed snapshot.

Professors can use Gantt charts to effectively plan and schedule their courses for the semester. They can outline the different topics, assignments, exams, and other activities on the chart, allowing them to visualize the entire course timeline. This helps professors ensure that they cover all the necessary material within the allocated time and maintain a balanced workload for students.
Gantt charts are valuable tools for professors overseeing research projects. They can use the chart to break down the project into smaller tasks, such as literature review, data collection, analysis, and writing. By assigning deadlines to each task and tracking progress on the chart, professors can effectively manage the project's timeline, identify potential bottlenecks, and ensure that the research stays on track.
Professors often supervise student projects, such as dissertations, theses, or independent research. Gantt charts can be used to create a clear timeline for each student's project, outlining milestones and deadlines. This allows professors to monitor the progress of each student, provide guidance when needed, and ensure that the project is completed within the specified timeframe.
Gantt charts can facilitate collaboration among faculty members working on shared projects or initiatives. Professors can allocate tasks and responsibilities to different team members, ensuring that everyone knows their role and the associated deadlines. This promotes effective teamwork, enhances accountability, and allows professors to track the progress of each task, ensuring that the project moves forward smoothly.
You can use Gantt chart software to visually plan and track the progress of your research projects. It allows you to break down your project into smaller tasks, set deadlines, and assign resources. By visualizing the timelines and dependencies, you can easily identify potential bottlenecks and adjust your schedule accordingly. Additionally, it enables collaboration and communication among team members, ensuring efficient project management and timely completion of research milestones.
Yes, many Gantt chart software platforms offer integrations with popular project management tools, allowing for seamless data sharing and collaboration between platforms. This integration enables you to combine the visual timeline and resource management capabilities of Gantt charts with the broader project management functionality of your existing tools, providing a comprehensive and streamlined project management experience.
Yes, Gantt chart software can help you track the progress of your students' assignments and manage their deadlines more efficiently. By visualizing the timeline of each assignment and its dependencies, you can easily monitor their progress and identify any potential delays. This allows you to allocate resources effectively, prioritize tasks, and make necessary adjustments to meet the deadlines. Additionally, it enhances communication and collaboration among students and educators, ensuring everyone is on the same page regarding assignment progress and due dates.