Manage all of your projects in one place.
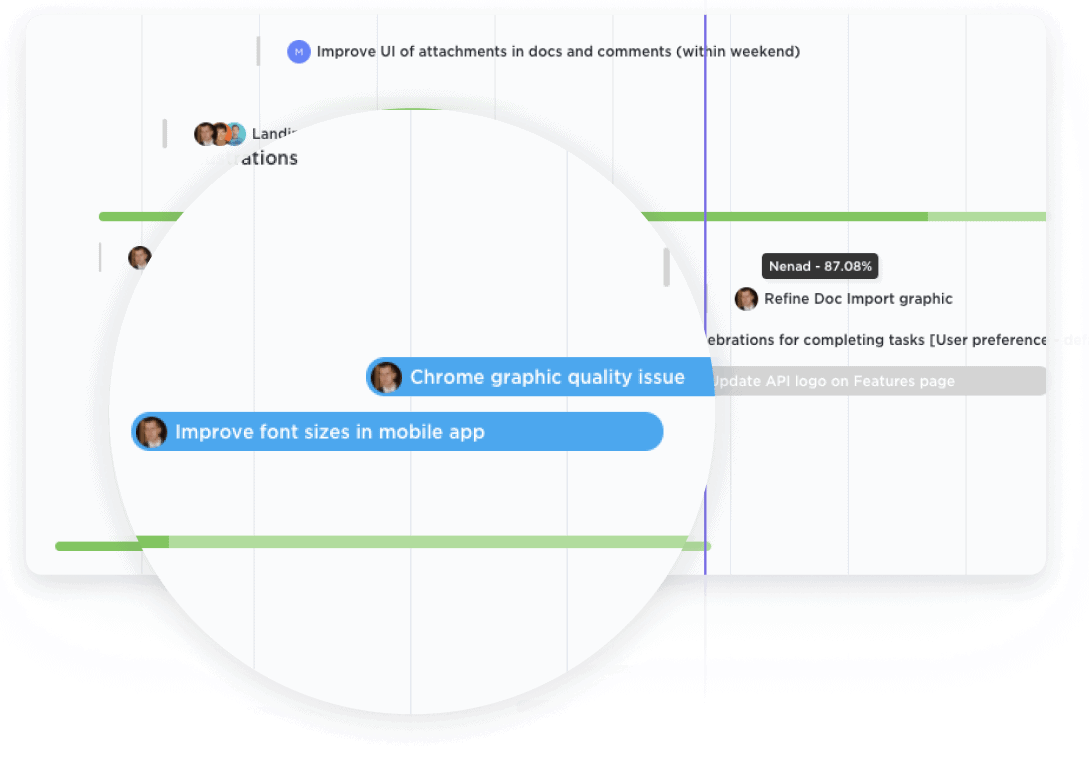
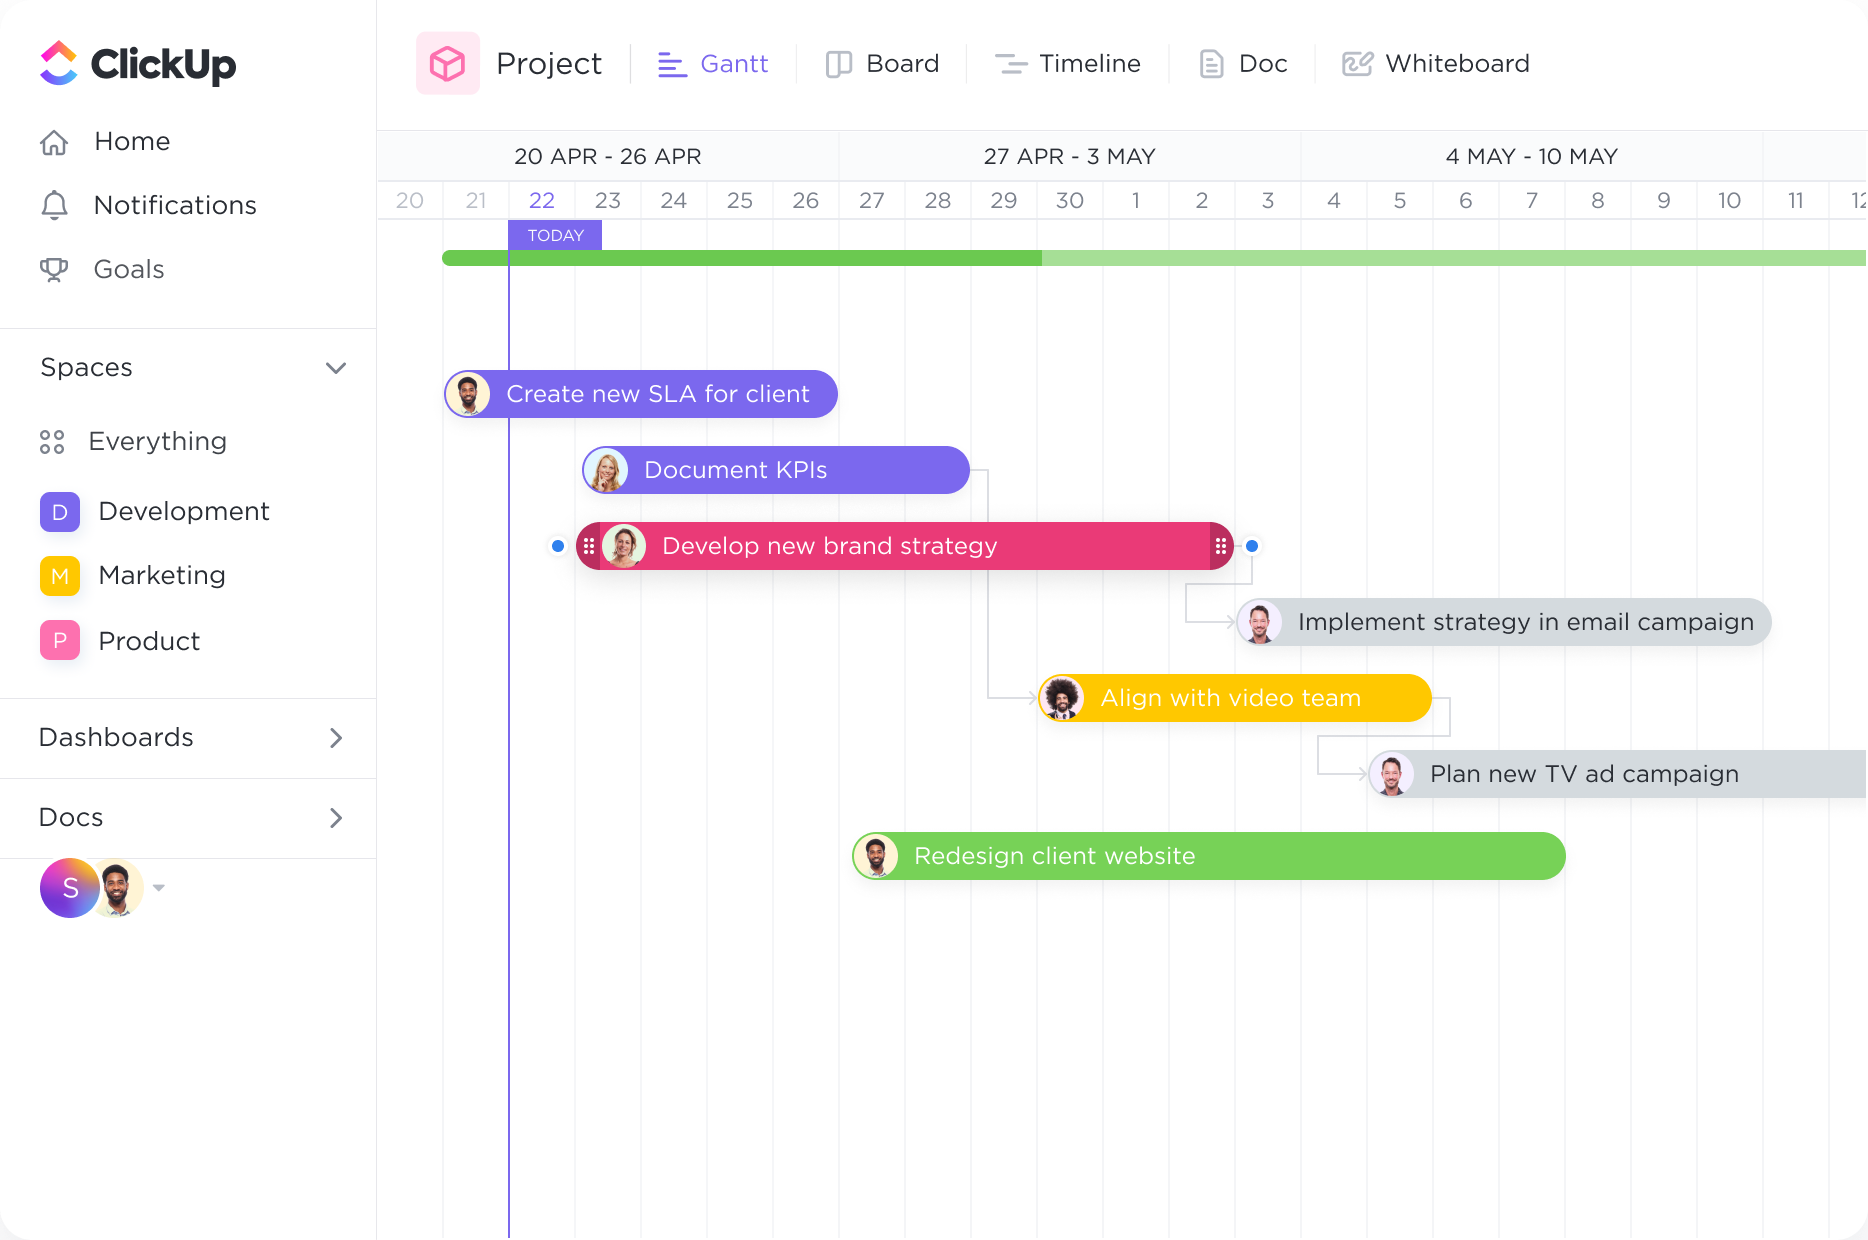
Get a bird's-eye view of all Spaces, Projects, Lists, and tasks in one Gantt chart. With clear coloring options, you can easily see what work is happening and where.

Create powerful Gantt Charts that are specifically designed for policymakers with ClickUp. Streamline your project management process and visualize complex tasks and timelines with ease. With ClickUp's intuitive interface and comprehensive features, you can easily plan, track, and adjust your projects to ensure successful policy implementation. Gain a clear overview of your tasks, deadlines, and dependencies, empowering you to make informed decisions and drive impactful change. Try ClickUp today and revolutionize the way you manage your policy initiatives.
Free forever.
No credit card.

Trusted by the world’s leading businesses
Get a bird's-eye view of all Spaces, Projects, Lists, and tasks in one Gantt chart. With clear coloring options, you can easily see what work is happening and where.

Intelligent dependency-path tracking shows you where potential bottlenecks might exist to prevent inefficiencies.
Gantt charts can be used to plan and monitor the implementation of policies. By breaking down the policy into specific tasks and assigning them to different stakeholders, policymakers can track the progress of each task and ensure that the policy is being implemented according to the planned timeline. This helps in identifying any delays or bottlenecks and allows for timely intervention to keep the policy implementation on track.
Policymakers often have a wide range of legislative initiatives to work on. Gantt charts can help in planning and prioritizing these initiatives by visualizing the timelines and dependencies between different bills or policies. This allows policymakers to allocate resources effectively, manage legislative deadlines, and ensure that important bills are given the necessary attention and priority.
Engaging with stakeholders and gathering public input is an essential part of the policymaking process. Gantt charts can be used to plan and schedule public consultations, stakeholder meetings, and other engagement activities. This ensures that policymakers have a clear timeline for these events and can allocate resources accordingly. It also helps in communicating the engagement process to stakeholders, providing transparency and accountability.
Periodic evaluation and review of policies are necessary to assess their effectiveness and make necessary adjustments. Gantt charts can be used to plan and schedule these evaluation activities, such as data collection, analysis, and stakeholder consultations. By visualizing the timeline for evaluation, policymakers can ensure that it is conducted in a timely manner and that the findings are integrated into future policy decisions.
Policymaking often involves coordination and collaboration between different government departments and agencies. Gantt charts can be used to allocate tasks and track the progress of each department's contributions to the policy development process. This promotes transparency and accountability, facilitates effective communication, and ensures that all departments are working together towards the common goal of developing and implementing sound policies.
Effective communication and reporting are crucial for policymakers to keep stakeholders informed about the progress of policy initiatives. Gantt charts can be used to create visual reports and updates that clearly show the timeline, milestones, and progress of each policy. This helps in conveying complex information in a concise and understandable manner, facilitating better communication and engagement with stakeholders.
Gantt chart software can help policymakers in managing and tracking their projects effectively by providing a visual representation of project timelines, tasks, and dependencies. This allows policymakers to easily identify critical tasks, track progress, and allocate resources efficiently. It also enables them to monitor project milestones, identify potential bottlenecks, and make informed decisions to ensure successful project completion.
Yes, many Gantt chart software options offer integrations with popular project management tools commonly used by policymakers. This enables seamless data synchronization and collaboration between different platforms, allowing policymakers to leverage the power of Gantt charts alongside their existing project management workflows.
Yes, Gantt chart software can assist policymakers in visualizing the dependencies and timelines of multiple projects, enabling them to allocate resources efficiently and make informed decisions. It provides a clear overview of project progress, identifies potential bottlenecks, and facilitates communication among stakeholders, leading to improved coordination and resource management.