Manage all of your projects in one place.
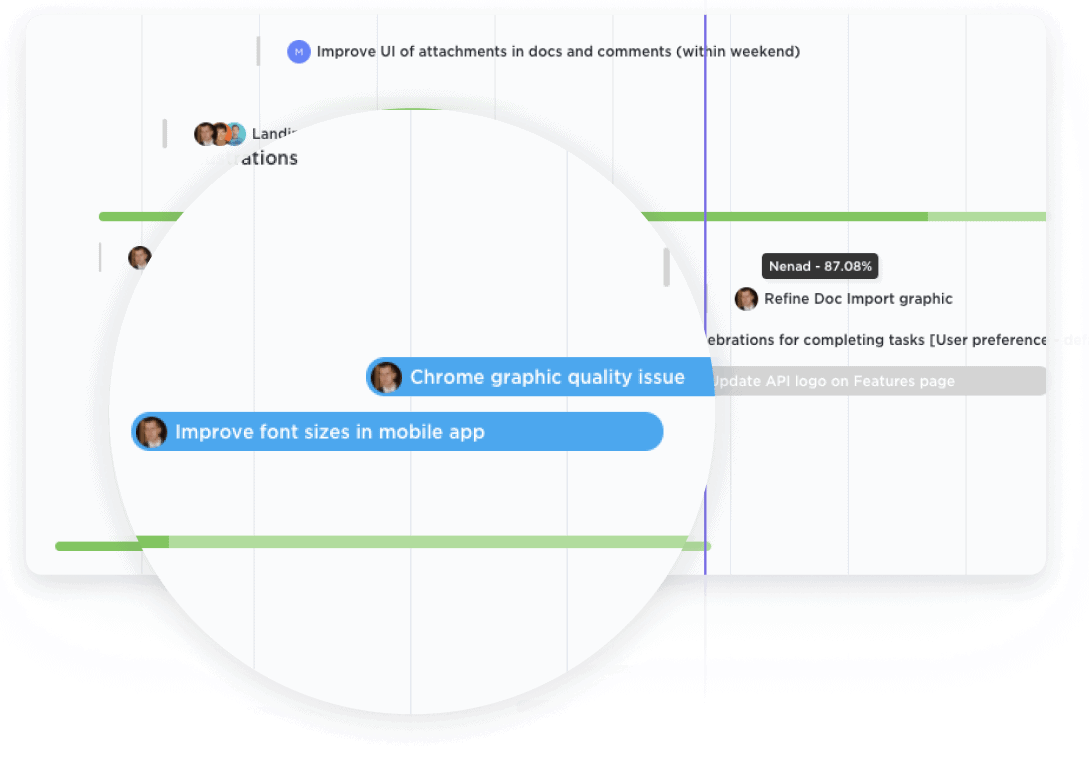
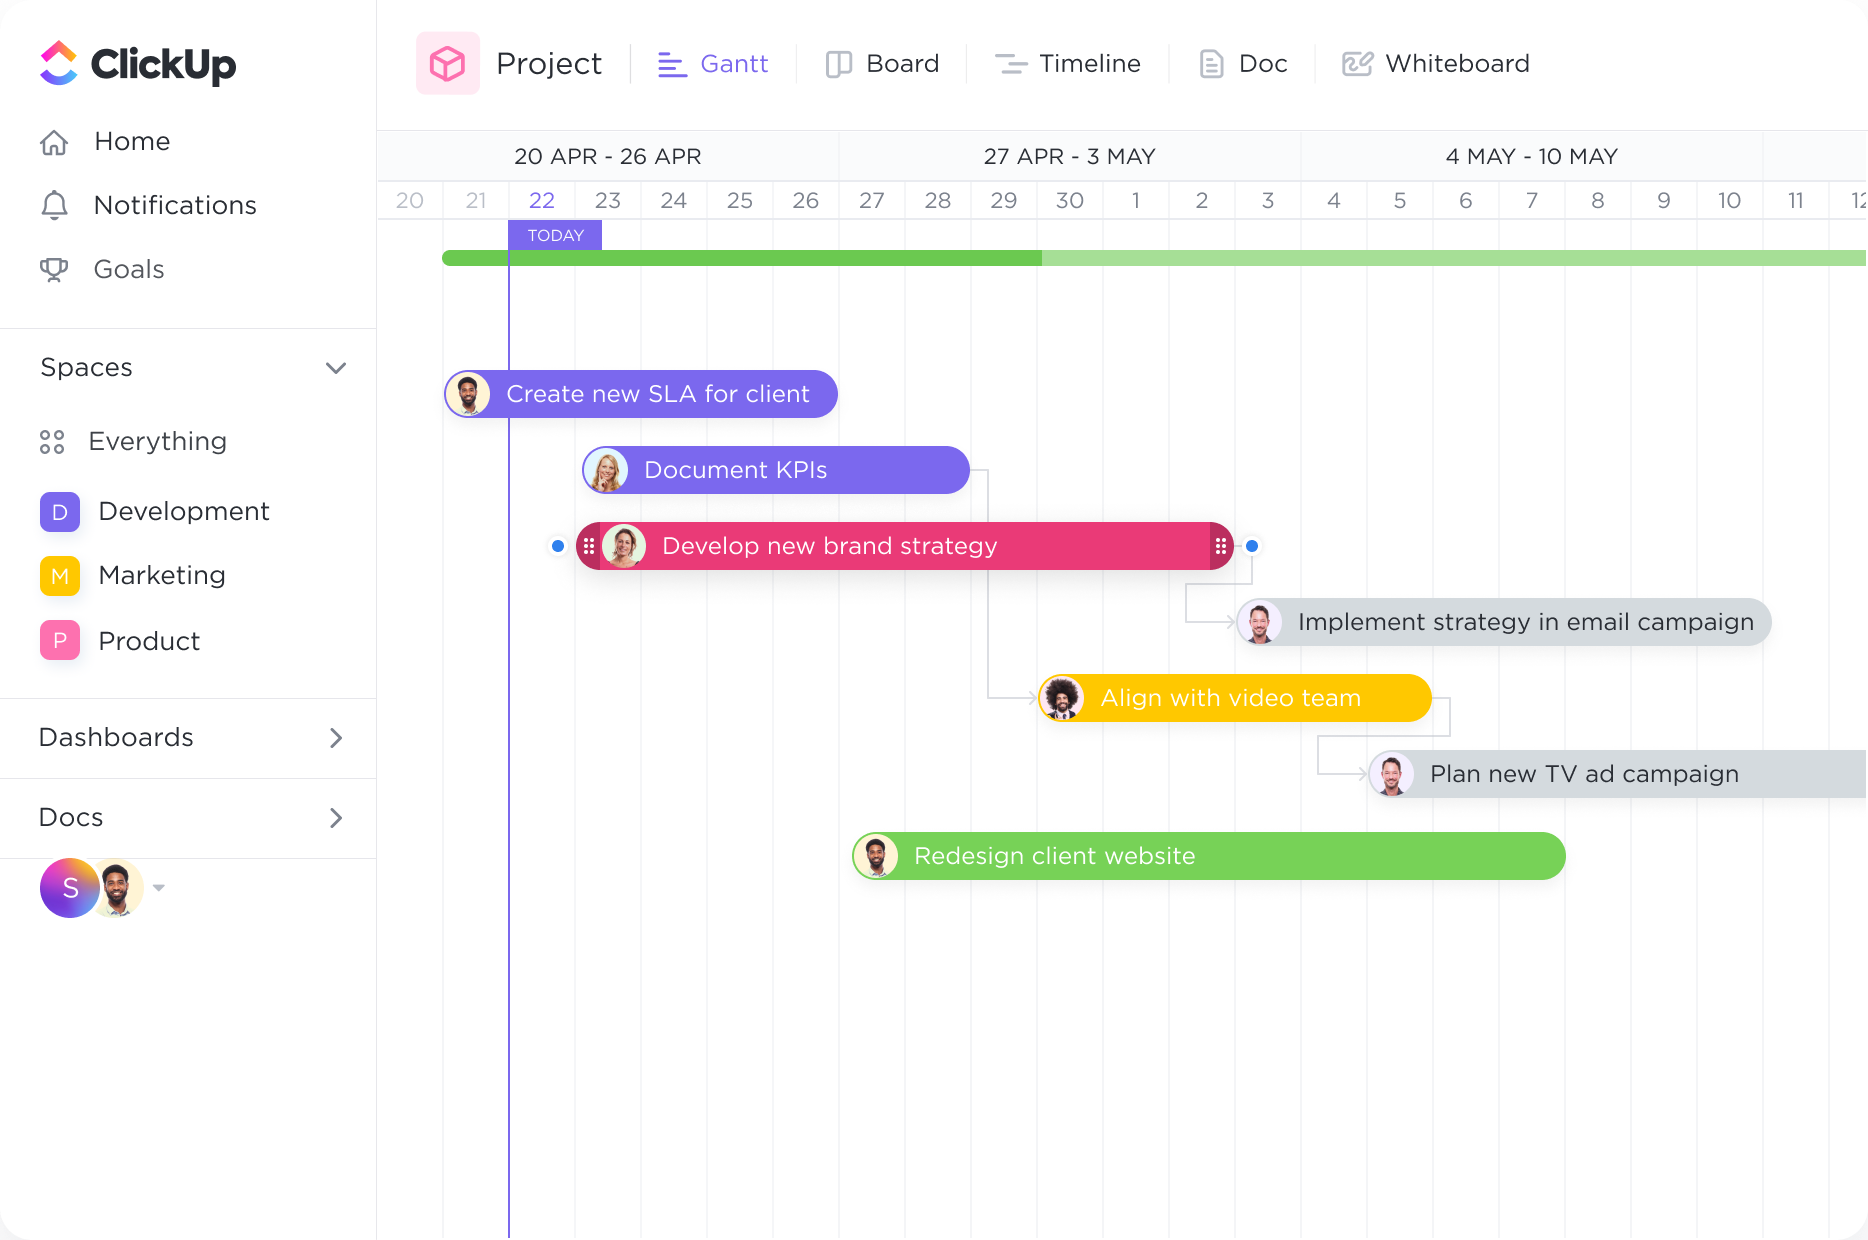
Get a bird's-eye view of all Spaces, Projects, Lists, and tasks in one Gantt chart. With clear coloring options, you can easily see what work is happening and where.

Supercharge your project planning with ClickUp's Gantt Chart software, designed specifically for Nanoengineers. Visualize and organize your tasks with ease, using a powerful tool that allows you to track progress, set dependencies, and meet deadlines effortlessly. Whether you're managing complex projects or mapping out intricate workflows, ClickUp's Gantt Chart software has got you covered. Revolutionize your project management process and achieve unprecedented efficiency with ClickUp.
Free forever.
No credit card.

Trusted by the world’s leading businesses
Get a bird's-eye view of all Spaces, Projects, Lists, and tasks in one Gantt chart. With clear coloring options, you can easily see what work is happening and where.

Intelligent dependency-path tracking shows you where potential bottlenecks might exist to prevent inefficiencies.
Nanoengineers often work on complex projects with multiple stages and dependencies. Gantt charts provide a visual representation of the project timeline, allowing nanoengineers to clearly see the sequence of tasks and their respective durations. This helps in planning and organizing project activities, setting deadlines, and identifying critical milestones.
Nanoengineering projects require the allocation of various resources, such as personnel, equipment, and materials. Gantt charts enable nanoengineers to allocate these resources efficiently by visualizing their availability and utilization across different project phases. This helps in optimizing resource allocation, avoiding bottlenecks, and ensuring smooth progress throughout the project.
Nanoengineering projects often involve collaboration among team members with different expertise. Gantt charts facilitate effective task management and collaboration by assigning specific tasks to individuals or teams and tracking their progress. This promotes accountability, enhances communication, and ensures that everyone is working towards the same project goals.
Nanoengineering projects can be subject to various risks and uncertainties, such as technical challenges, regulatory issues, or supply chain disruptions. Gantt charts allow nanoengineers to identify potential risks and plan contingencies by incorporating them into the project timeline. This helps in proactively managing risks, mitigating their impact, and ensuring project success.
Tracking project performance and monitoring progress is essential for nanoengineers to ensure that the project is on track and meeting its objectives. Gantt charts provide a visual representation of task dependencies and progress, allowing nanoengineers to easily track the completion of tasks, identify delays or bottlenecks, and take corrective actions if necessary. This helps in maintaining project momentum and meeting project deadlines.
You can use Gantt chart software to visually plan and track the progress of your nanoengineering projects. It allows you to break down your projects into smaller tasks, set dependencies, and allocate resources. By having a clear timeline and visual representation of your project, you can easily identify potential bottlenecks, adjust schedules, and ensure that tasks are completed on time. This helps you stay organized, improve project coordination, and make informed decisions throughout the project lifecycle.
There is no specific Gantt chart software recommended for nanoengineers working on complex projects. However, there are many project management software options available that include Gantt chart functionalities, such as Microsoft Project, Smartsheet, and Asana. It is important to evaluate the specific needs of your projects and choose a software that best aligns with your requirements and preferences.
A Gantt chart software for nanoengineers should have features such as the ability to track and manage complex research and development tasks, incorporate precise time estimates for experiments and analysis, support collaboration and communication among team members, and provide visualization tools for monitoring progress and identifying potential bottlenecks in nanotechnology projects.