Organize and set priorities.
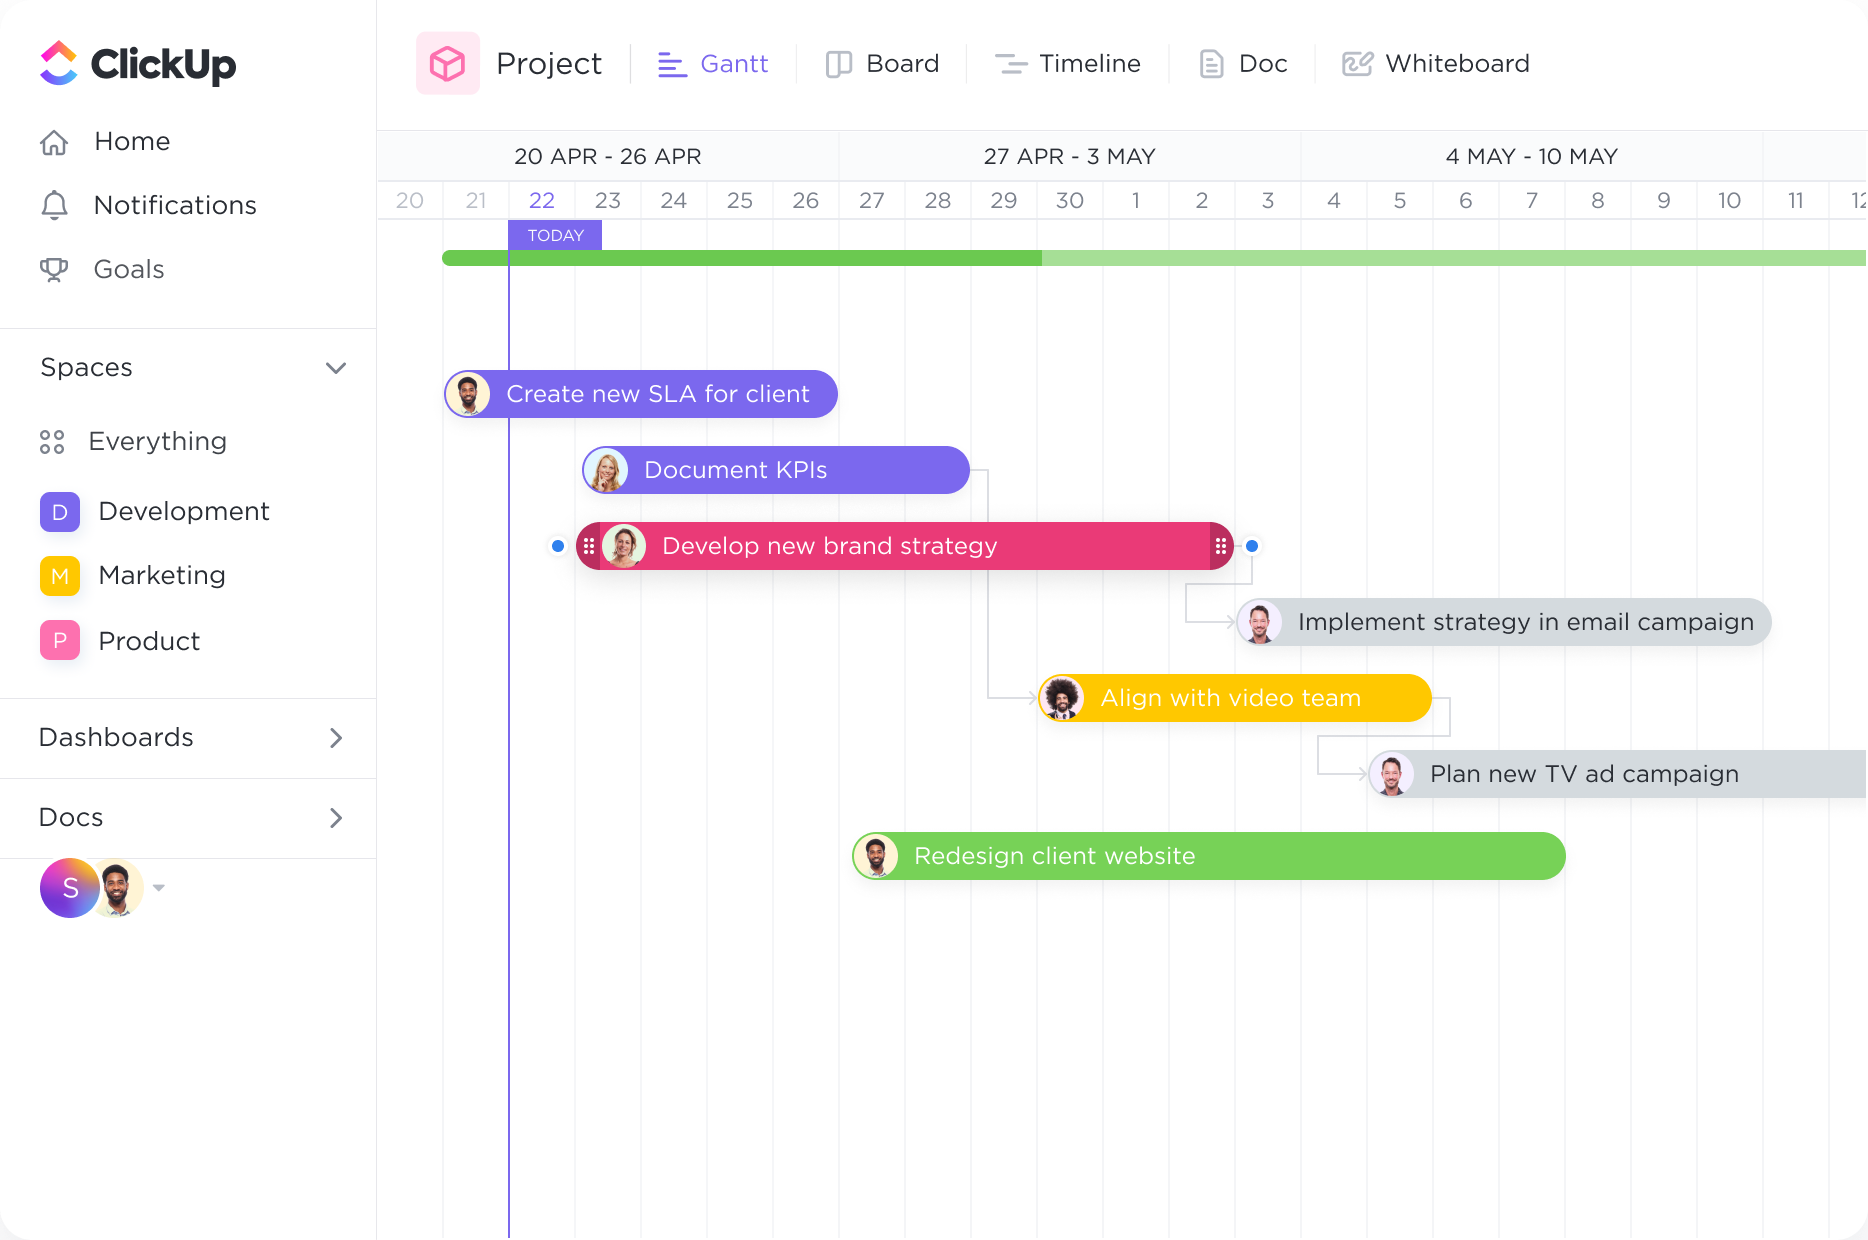
Organize how you see your tasks with quick sorting. Create cascading views with a single click to easily see what important tasks are coming next.
Supercharge your mobile design projects with ClickUp's Gantt Chart software. Streamline your workflow and stay organized with the power of visual planning. Create custom Gantt Charts that fit the unique needs of mobile designers, ensuring seamless collaboration and efficient project management. Take control of your projects and achieve success with ClickUp's Gantt Chart software.
Free forever.
No credit card.

Trusted by the world’s leading businesses
Organize how you see your tasks with quick sorting. Create cascading views with a single click to easily see what important tasks are coming next.
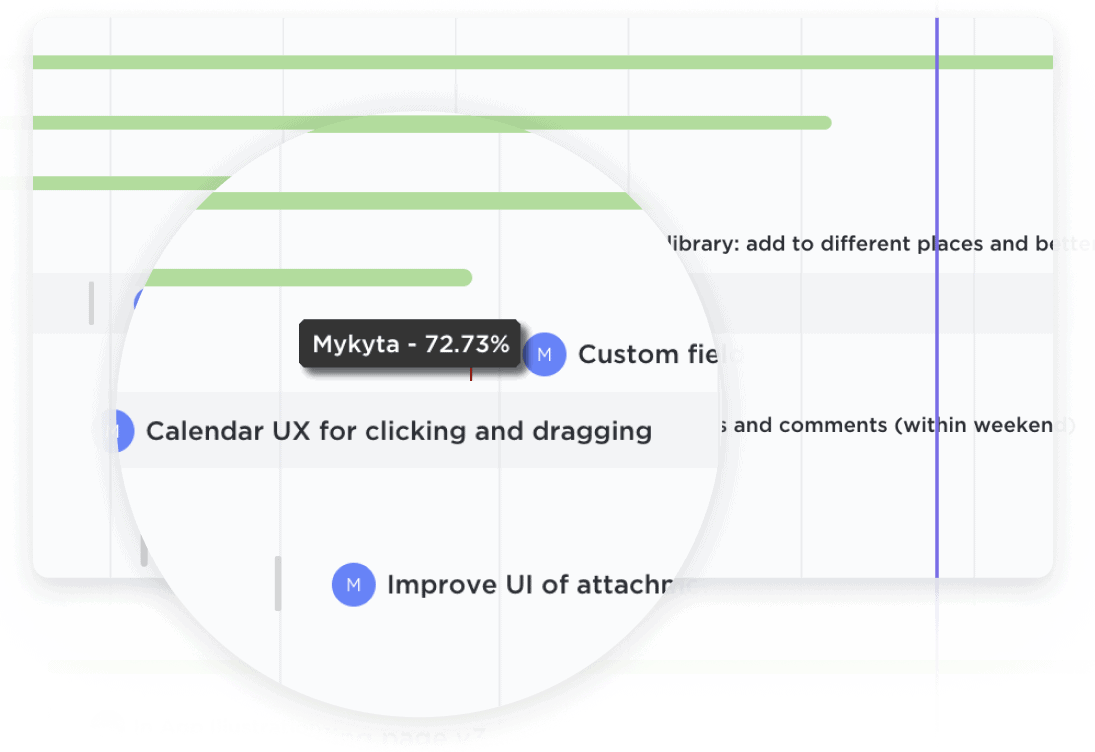
Easily update projects with a simple drag-and-drop action to collaborate amongst your team in real-time. Dynamic progress percentages provide a detailed snapshot.

Mobile designers can use Gantt charts to visualize and manage project timelines, deadlines, and milestones. By breaking down the design process into phases such as wireframing, prototyping, and testing, designers can create a clear roadmap for their projects. Gantt charts allow designers to allocate timeframes for each phase, ensuring efficient project management and timely delivery.
Collaboration is key in mobile design projects, and Gantt charts can facilitate effective team collaboration. Designers can assign tasks to team members, track progress, and ensure that everyone is working towards the same goals. Gantt charts provide a centralized view of tasks, responsibilities, and dependencies, promoting transparency and accountability within the design team.
Mobile design projects often require the allocation and management of resources such as design tools, software licenses, and external contractors. Gantt charts can help designers optimize the use of these resources by scheduling and tracking their availability. By visualizing resource allocation, designers can ensure that they have the necessary tools and support throughout the design process.
Gantt charts can be used to plan and track iterative design processes and feedback loops. Designers can set milestones for design iterations and allocate time for gathering feedback from stakeholders or conducting user testing. By incorporating these milestones into the Gantt chart, designers can ensure that they have dedicated timeframes for refining and improving their designs based on feedback.
In mobile design projects, close coordination between designers and developers is essential. Gantt charts can help facilitate this coordination by aligning design and development timelines. Designers can schedule design handoffs to developers, ensuring that the development process can seamlessly proceed without delays. Gantt charts provide a visual representation of the entire design and development workflow, allowing both teams to stay on track and meet project deadlines.
Gantt chart software allows you to visually plan and track the progress of your mobile design projects. You can create a timeline of tasks, set dependencies, and allocate resources. This helps you manage project deadlines, identify bottlenecks, and ensure a smooth workflow. Additionally, it enhances collaboration and communication among team members, resulting in more efficient project management and successful mobile design projects.
Yes, many Gantt chart software offer features specifically designed for mobile designers, such as mobile-responsive interfaces, mobile app integration, and task management on the go. These features enable mobile designers to access and update project timelines and tasks from their mobile devices, ensuring seamless collaboration and real-time project tracking, regardless of their location.
Yes, Gantt chart software can help you track and manage the progress of multiple mobile design projects simultaneously by providing a visual representation of project timelines, tasks, and dependencies. It enables you to allocate resources effectively, identify potential scheduling conflicts, and track the progress of each project in real-time. This allows for better coordination, efficient decision-making, and improved project outcomes.