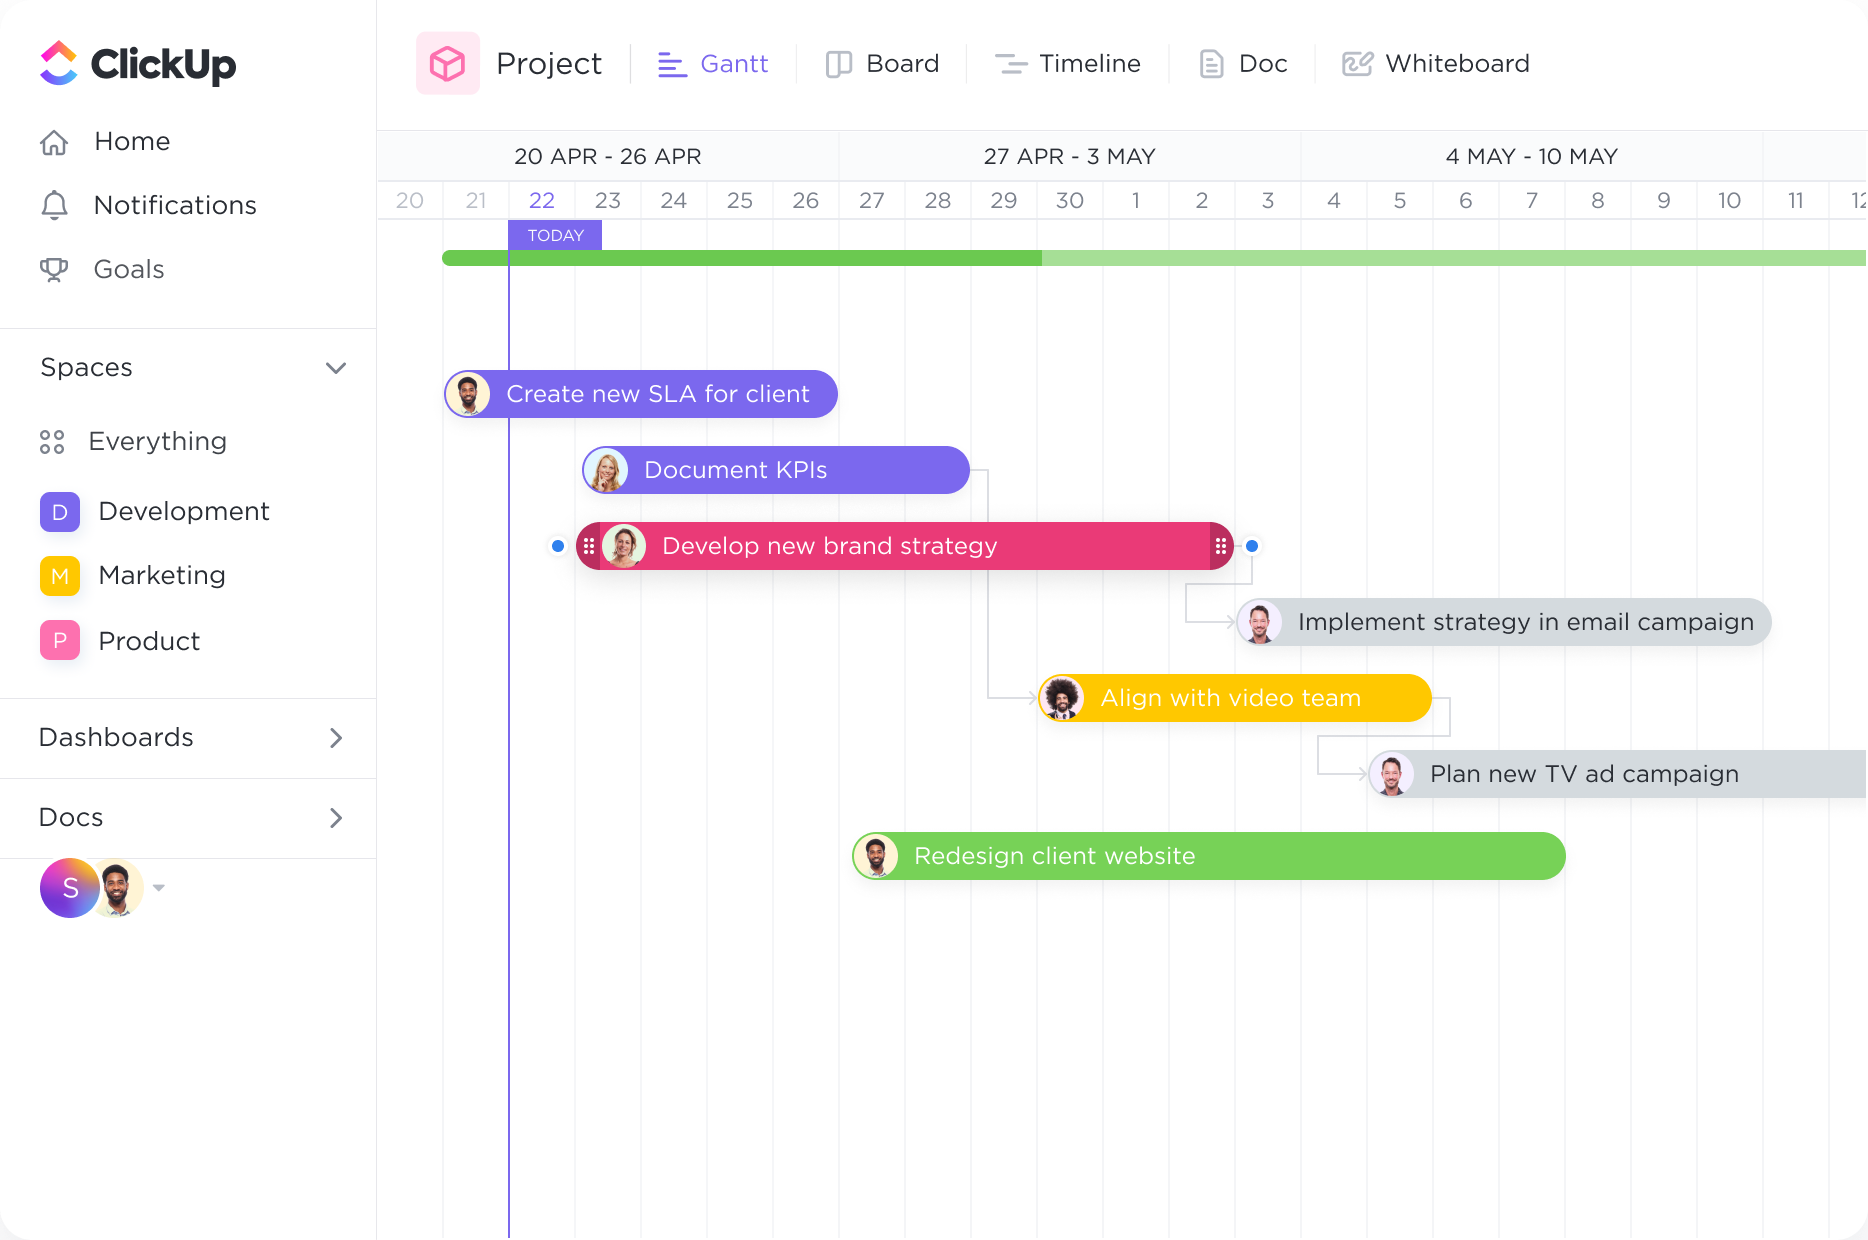
Organize and set priorities.
Organize how you see your tasks with quick sorting. Create cascading views with a single click to easily see what important tasks are coming next.
Supercharge your market research projects with ClickUp's Gantt Chart software. Streamline your workflow, assign tasks, and meet deadlines seamlessly. Visualize your project's progress and easily collaborate with your team. Take control of your market research process and achieve success with ClickUp's powerful Gantt Chart software.
Free forever.
No credit card.

Trusted by the world’s leading businesses
Organize how you see your tasks with quick sorting. Create cascading views with a single click to easily see what important tasks are coming next.
Create tasks and link them with dependencies. Dragging a task with dependencies will automatically reschedule tasks in the chain
Gantt charts are an invaluable tool for market researchers to visualize and manage the entire lifecycle of a research project. From defining objectives and creating research plans to analyzing data and presenting findings, Gantt charts provide a comprehensive overview of project timelines, deadlines, and milestones. This allows market researchers to effectively plan and execute their projects, ensuring timely delivery and successful outcomes.
Market research projects often involve collaboration among multiple team members, such as researchers, analysts, and data collectors. Gantt charts enable efficient task allocation by clearly assigning responsibilities to team members and tracking their progress. This promotes effective collaboration, ensures accountability, and allows for seamless coordination among team members, leading to more efficient and successful market research endeavors.
Market research projects require the allocation and management of various resources, including personnel, budget, and equipment. Gantt charts provide a visual representation of resource availability and utilization, allowing market researchers to optimize the allocation of resources. This ensures that the right resources are allocated to the right tasks at the right time, maximizing efficiency and minimizing wastage.
Meeting milestones and deadlines is crucial in market research to ensure timely completion of projects and deliverables. Gantt charts enable market researchers to track and monitor key milestones and deadlines throughout the research process. By visualizing these important dates, researchers can prioritize tasks, identify potential bottlenecks, and take proactive measures to stay on track and meet project objectives.
Market research projects are often subject to changes, whether it's due to evolving client requirements, shifting market dynamics, or unforeseen challenges. Gantt charts provide market researchers with the flexibility to adjust timelines and tasks based on real-time progress and changes in project scope. This allows researchers to adapt their plans and strategies accordingly, ensuring that the research stays on track and aligns with the evolving needs of the market.
Gantt chart software can help market researchers effectively plan and manage their projects by providing a visual representation of project timelines and tasks. It allows for the identification of dependencies and critical paths, enabling researchers to allocate resources efficiently and prioritize tasks. Additionally, Gantt charts facilitate communication and collaboration among team members, ensuring everyone is aware of project progress and deadlines. This ultimately leads to improved project coordination, increased productivity, and more accurate forecasting in market research.
Gantt chart software can assist in managing and tracking market research projects effectively by visually organizing and tracking tasks, timelines, and dependencies. It enables you to allocate resources, set deadlines, and monitor progress in real-time. By providing a clear overview of project milestones and deadlines, it helps to ensure timely completion of research activities and facilitates effective project coordination and communication among team members.
Yes, Gantt chart software offers features that cater to the unique needs of market researchers. It allows for the scheduling and tracking of market research activities, such as surveys, focus groups, and data analysis. It enables the allocation of resources and the management of dependencies to ensure timely completion of research tasks. Additionally, it provides a visual representation of project timelines, facilitating collaboration and communication among team members.