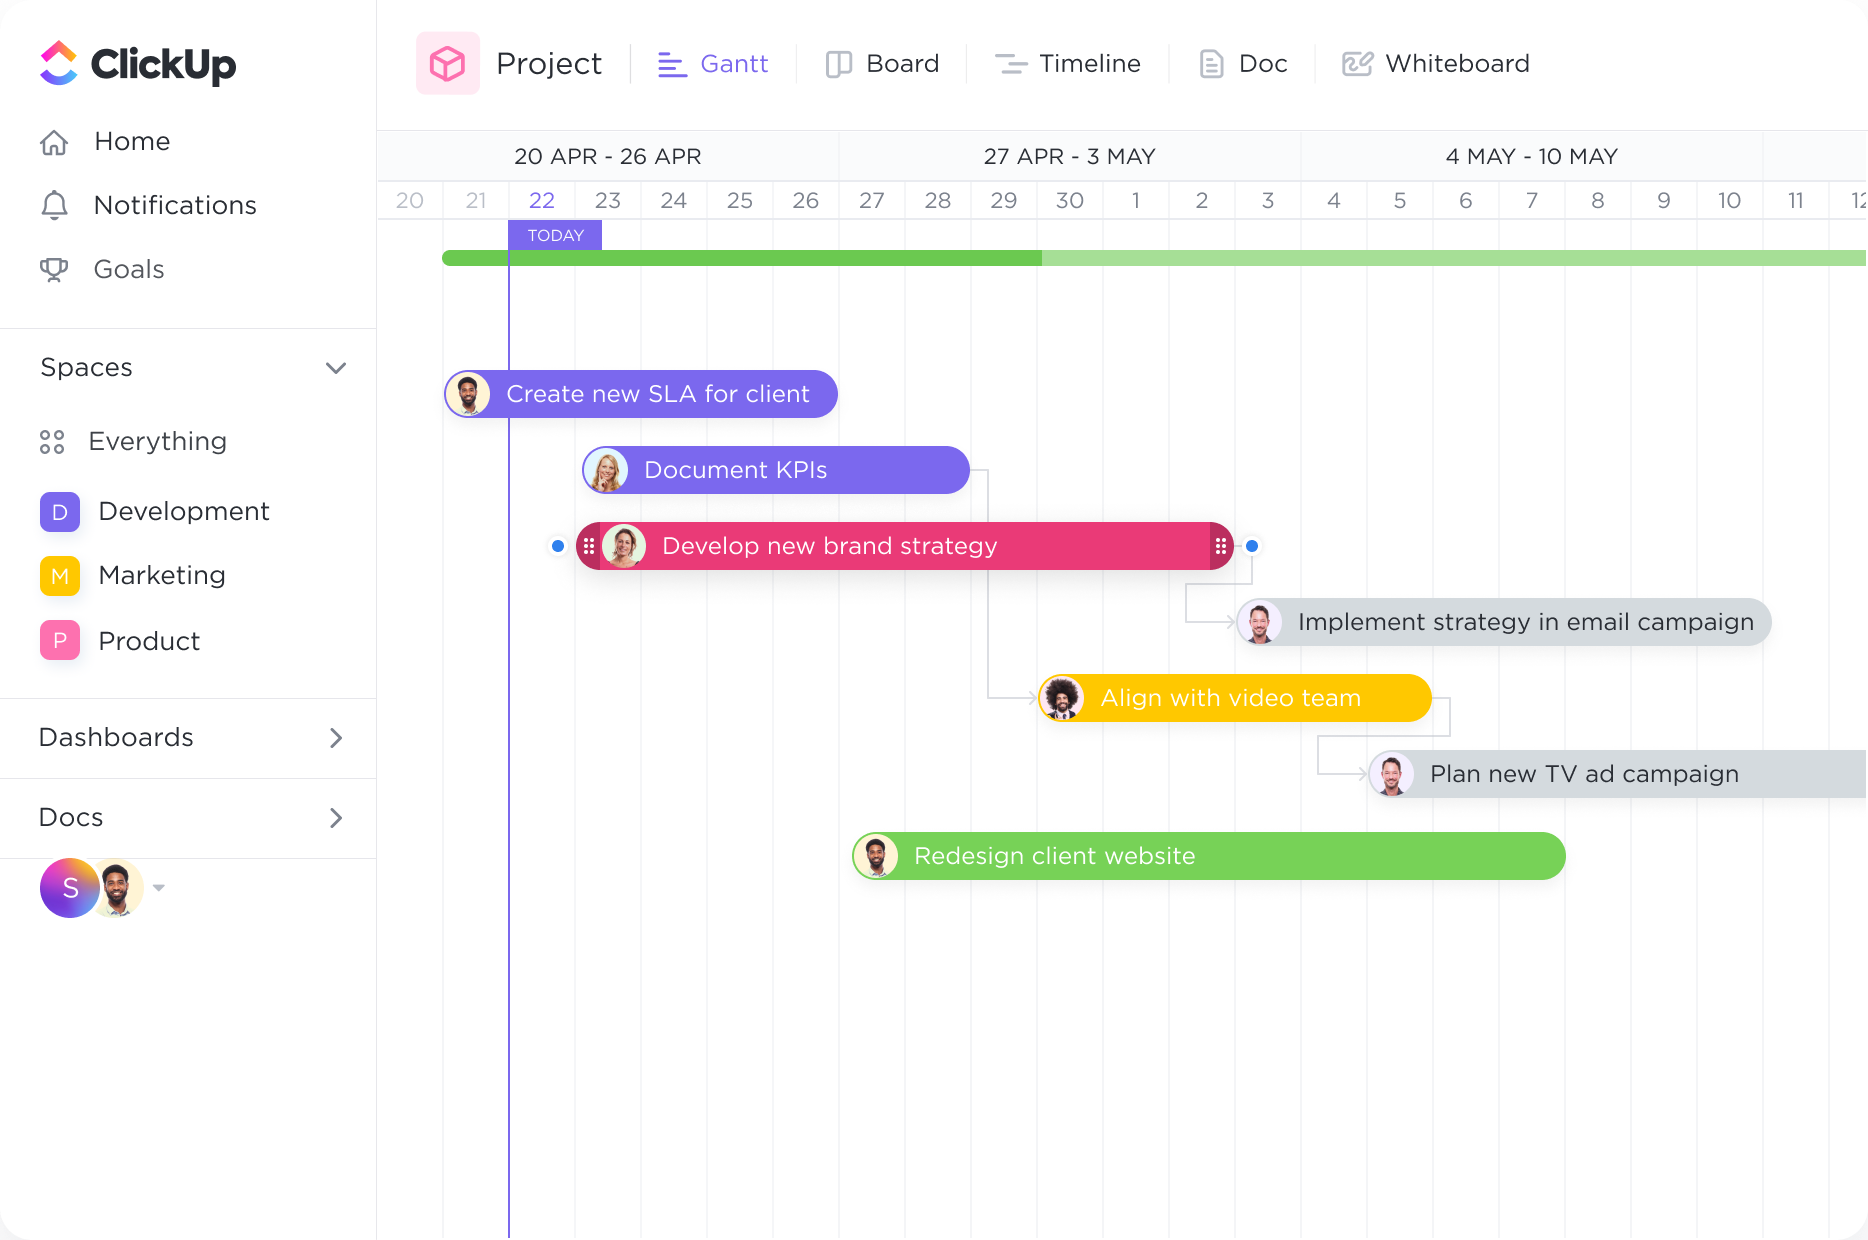
Organize and set priorities.
Organize how you see your tasks with quick sorting. Create cascading views with a single click to easily see what important tasks are coming next.
Supercharge your financial analysis with ClickUp's Gantt Chart software! Streamline your project planning and execution using our intuitive interface and powerful features. Easily create customized Gantt Charts that are specifically designed for the needs of financial analysts. Stay on top of deadlines, track progress, and collaborate seamlessly with your team, all in one place. Take your financial analysis to the next level with ClickUp's Gantt Chart software.
Free forever.
No credit card.

Trusted by the world’s leading businesses
Organize how you see your tasks with quick sorting. Create cascading views with a single click to easily see what important tasks are coming next.
With the Gantt chart's dynamic timeline, you can easily schedule tasks, keep up with project progress, manage deadlines, and handle bottlenecks.
Gantt charts can be invaluable tools for financial analysts when it comes to planning and budgeting. By using a Gantt chart, analysts can map out the various stages and activities involved in financial planning, such as gathering data, conducting analysis, creating forecasts, and developing budgets. This visual representation helps to ensure that all necessary tasks are accounted for and allows analysts to allocate resources and time effectively.
Managing investment portfolios requires careful monitoring and coordination of various assets and activities. Gantt charts can provide financial analysts with a clear overview of the different investment projects and their timelines. This allows analysts to track the progress of each investment, allocate resources accordingly, and make informed decisions regarding portfolio adjustments or reallocations.
Financial analysts often need to prepare regular reports and conduct in-depth analysis to provide insights and recommendations to stakeholders. Gantt charts can assist in organizing and scheduling the tasks involved in this process, such as data collection, analysis, report writing, and presentation preparation. By visualizing these tasks and their dependencies, analysts can ensure that reporting deadlines are met and that the analysis is conducted in a timely manner.
Mergers and acquisitions (M&A) involve complex processes and timelines. Gantt charts can help financial analysts manage and track the various stages of an M&A deal, including due diligence, valuation, negotiation, and integration planning. By visualizing the critical milestones and dependencies, analysts can ensure that each step is completed on time and that all parties involved are aligned throughout the process.
Financial analysts play a crucial role in identifying and managing risks within an organization. Gantt charts can be used to create risk management plans, outlining the activities and timelines associated with risk assessment, mitigation strategies, and monitoring. By visualizing the risk management process, analysts can proactively address potential risks, allocate resources effectively, and ensure that risk mitigation measures are implemented in a timely manner.
Financial analysts often oversee projects that involve financial modeling, forecasting, or system implementations. Gantt charts can serve as project management tools, helping analysts plan and track the various tasks and milestones associated with these projects. By visualizing the project timeline, dependencies, and resource allocation, analysts can ensure that projects are executed efficiently, deadlines are met, and stakeholders are kept informed of progress.
You can use Gantt chart software to visually map out financial project timelines and task dependencies. This allows for the tracking and monitoring of task progress, deadlines, and resource allocation. It also enables the identification of potential bottlenecks and delays, facilitating proactive adjustments and decision-making. Additionally, Gantt charts provide a clear overview of project milestones and dependencies, enhancing communication and collaboration among team members involved in financial projects.
Gantt chart software provides financial analysts with a visual representation of project timelines, dependencies, and resource allocation. It enables the tracking and monitoring of financial tasks, milestones, and deadlines. Additionally, it allows for the identification of potential scheduling conflicts and bottlenecks, facilitating efficient resource allocation. Furthermore, Gantt charts enhance communication and collaboration among team members, ensuring better coordination and decision-making for financial analysis projects.
Yes, Gantt chart software can help financial analysts in improving financial forecasting and budgeting processes. It allows for the visualization of project timelines, tasks, and resource allocation, enabling more accurate and realistic financial projections. It also facilitates tracking and monitoring of project costs and expenditures, enabling better budget control and adjustment. Overall, Gantt chart software enhances financial analysts' ability to effectively plan and manage financial resources.