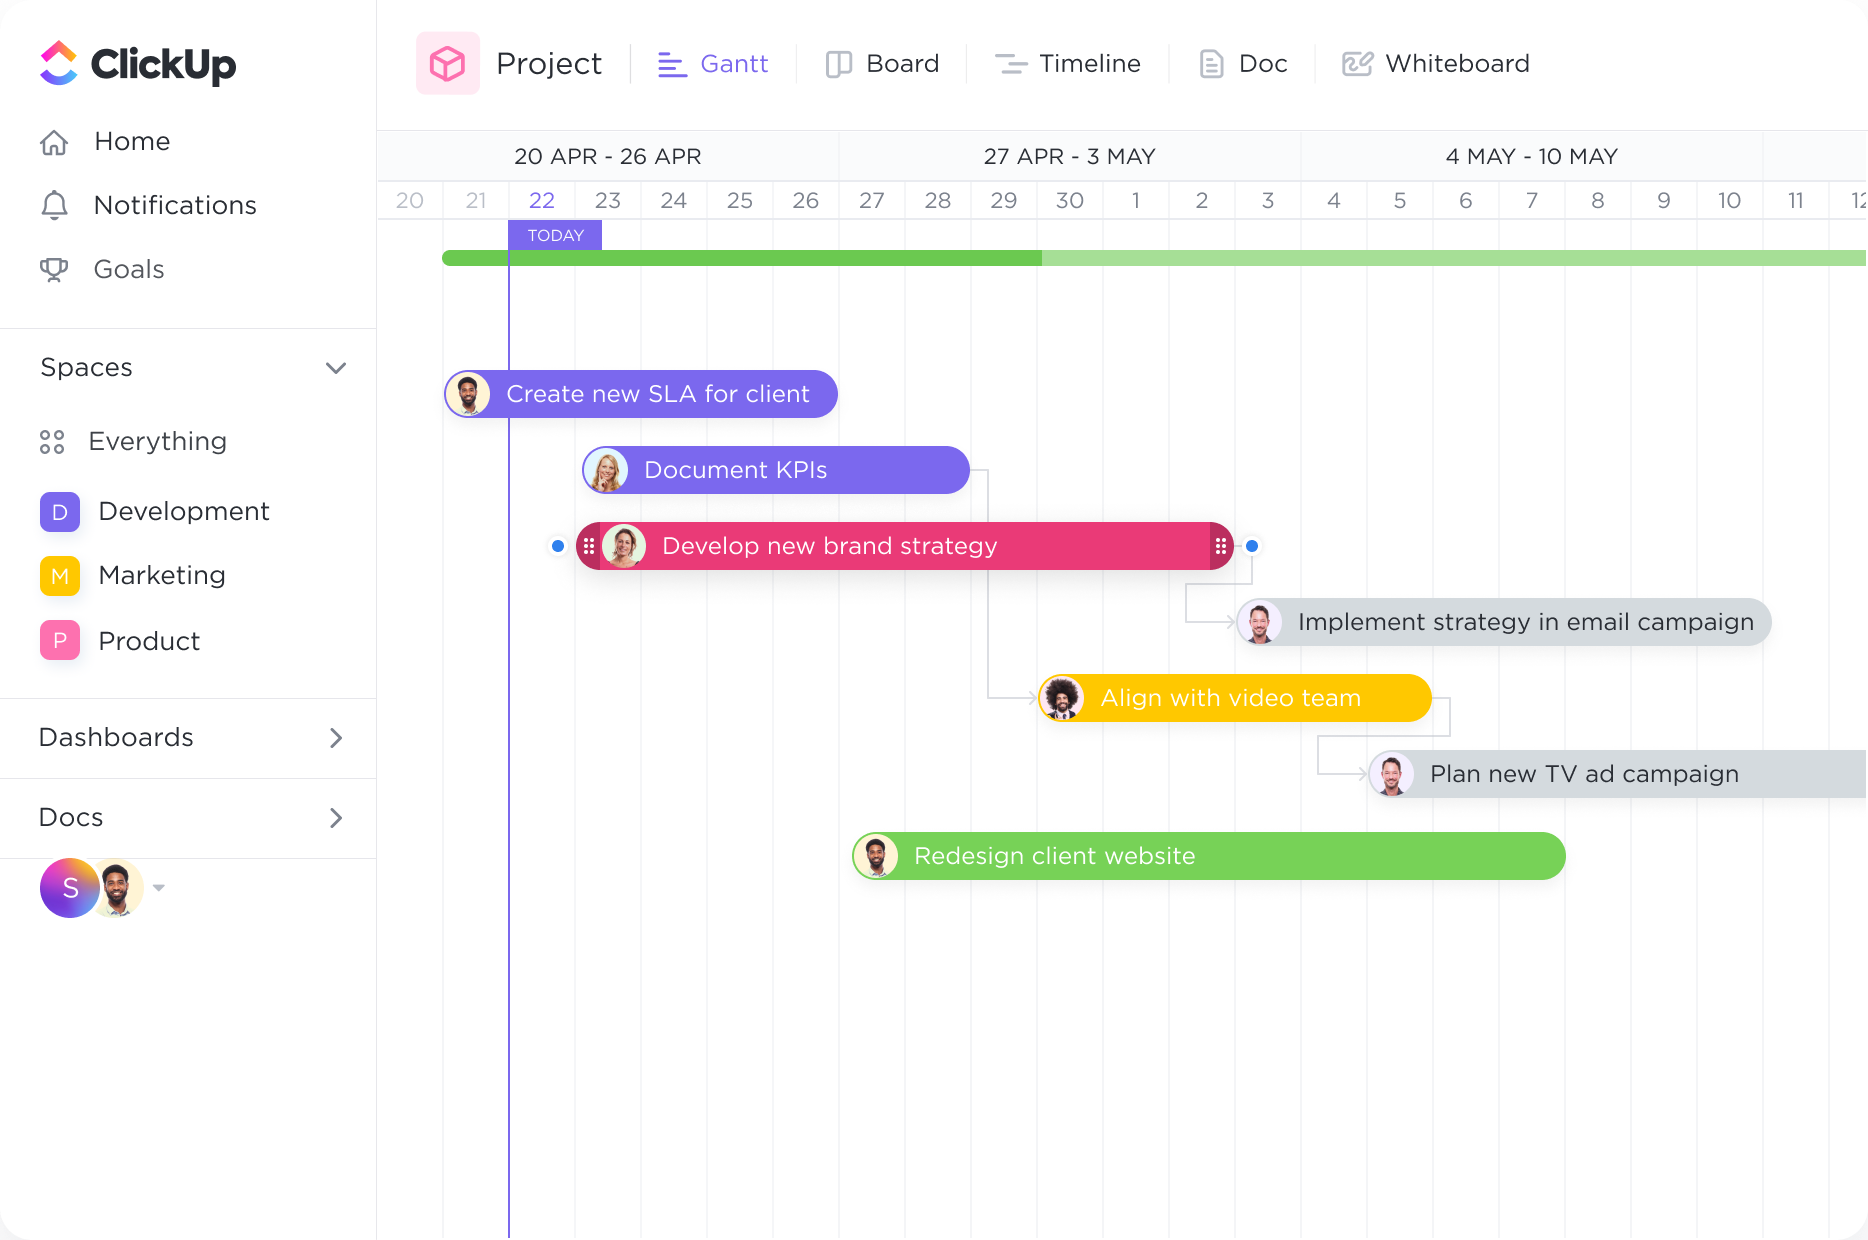
Set task dependencies.
Create tasks and link them with dependencies. Dragging a task with dependencies will automatically reschedule tasks in the chain
Supercharge your productivity with ClickUp's Gantt Chart software, designed to empower Data Analysts like never before. Visualize your projects, track progress, and meet deadlines effortlessly with the intuitive interface and powerful features of ClickUp's Gantt Chart. Seamlessly integrate data analysis tasks, allocate resources, and collaborate with your team in real-time, all within one comprehensive platform. Take control of your projects and drive success with ClickUp's Gantt Chart software.
Free forever.
No credit card.

Trusted by the world’s leading businesses
Create tasks and link them with dependencies. Dragging a task with dependencies will automatically reschedule tasks in the chain
With the Gantt chart's dynamic timeline, you can easily schedule tasks, keep up with project progress, manage deadlines, and handle bottlenecks.
Data analysts often work on complex projects that involve multiple tasks and deadlines. Gantt charts provide a visual representation of project timelines, allowing data analysts to easily track and manage their work. By visualizing project milestones, deadlines, and dependencies, Gantt charts help data analysts stay organized and ensure that projects are completed on time.
Data analysis projects often require collaboration among team members. Gantt charts can be used to allocate tasks among team members and track their progress collectively. By assigning specific tasks to individuals and setting deadlines, Gantt charts facilitate effective task management and promote collaboration. This ensures that everyone on the team is aware of their responsibilities and contributes to the project's success.
Data analysis projects often involve the use of various resources, such as datasets, software tools, and computing resources. Gantt charts can help data analysts manage and optimize the use of these resources. By visualizing resource availability and allocation, Gantt charts enable data analysts to plan and schedule their work effectively. This ensures that resources are utilized efficiently and prevents bottlenecks or delays in the analysis process.
Data analysts need to track their progress and report on their findings regularly. Gantt charts can be used to monitor the progress of data analysis projects and track key milestones. By updating the Gantt chart with completed tasks and milestones, data analysts can easily see their progress and identify any potential delays or issues. This allows them to take corrective actions and ensure that projects stay on track.
Gantt chart software can help you track and manage your data analysis projects effectively by providing a visual representation of project timelines, tasks, and dependencies. It allows you to allocate resources, set milestones, and monitor progress in real-time. This enables you to identify bottlenecks, adjust schedules, and ensure timely completion of tasks, resulting in more efficient data analysis project management.
Gantt chart software can provide data analysts with a visual representation of project tasks and timelines. It enables the identification of dependencies and critical paths, allowing for efficient project planning and resource allocation. Additionally, it facilitates the tracking of task progress and milestones, improving project coordination and communication among team members. Overall, Gantt chart software enhances data analysts' ability to manage and analyze projects effectively.
Yes, Gantt chart software can be integrated with data analysis tools to streamline your workflow. This integration allows for seamless data sharing and analysis, enabling you to make data-driven decisions and monitor project progress more effectively.