Stay ahead of every deadline.
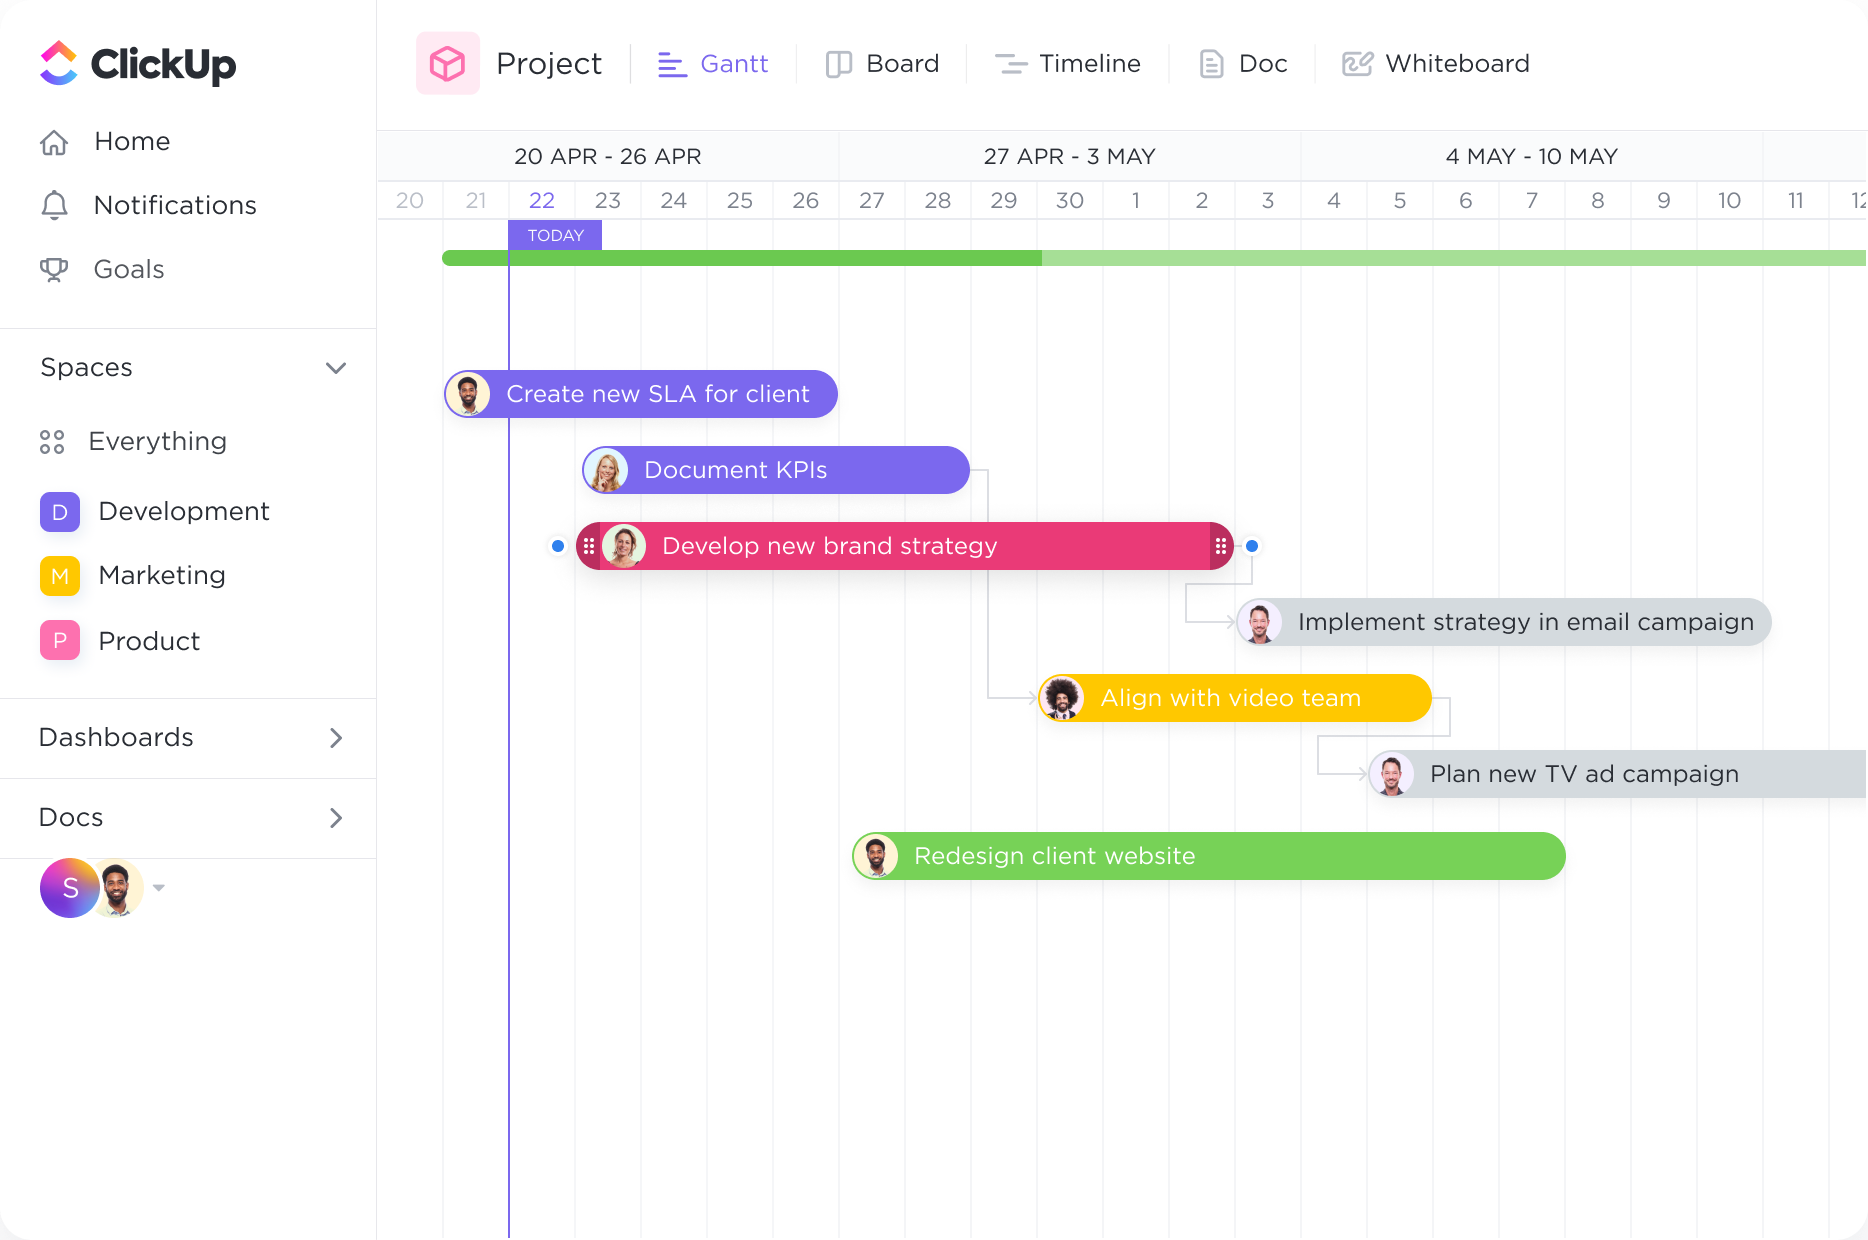
With the Gantt chart's dynamic timeline, you can easily schedule tasks, keep up with project progress, manage deadlines, and handle bottlenecks.
Supercharge your project planning with ClickUp, the ultimate Gantt Chart software for crop scientists. Streamline your research, track progress, and meet deadlines effortlessly using our intuitive platform. Visualize your projects, allocate resources, and collaborate seamlessly with your team to achieve maximum productivity. Don't let complex project management slow you down - try ClickUp today and revolutionize the way you plan and execute your crop science projects.
Free forever.
No credit card.

Trusted by the world’s leading businesses
With the Gantt chart's dynamic timeline, you can easily schedule tasks, keep up with project progress, manage deadlines, and handle bottlenecks.
Get a bird's-eye view of all Spaces, Projects, Lists, and tasks in one Gantt chart. With clear coloring options, you can easily see what work is happening and where.

Crop scientists often need to plan and schedule their activities based on the growing seasons and specific crop requirements. A Gantt chart can be used to outline the different stages of crop production, such as planting, irrigation, fertilization, pest control, and harvesting. By visualizing these activities, crop scientists can effectively plan their tasks, allocate resources, and ensure timely execution throughout the crop cycle.
Crop scientists frequently conduct field experiments to test different variables and study the impact on crop growth and yield. Gantt charts can be utilized to plan and manage these experiments, including tasks such as plot preparation, seed sowing, data collection, and analysis. By using a Gantt chart, crop scientists can track the progress of each experiment, allocate resources, and ensure that all necessary tasks are completed within the desired timeframe.
Monitoring and managing pests and diseases are crucial aspects of crop science. Gantt charts can be employed to create a schedule for regular monitoring activities, such as scouting fields, collecting samples, and implementing control measures. By visualizing these tasks, crop scientists can ensure that pest and disease management activities are carried out at the appropriate times, reducing the risk of crop damage and optimizing yield potential.
Crop rotation and soil management practices are essential for maintaining soil health and preventing the buildup of pests and diseases. Gantt charts can be used to plan and track crop rotation schedules, cover crop planting, soil testing, and other soil management activities. By using a Gantt chart, crop scientists can ensure that crop rotation and soil management practices are implemented in a timely manner, promoting sustainable agriculture and improving long-term crop productivity.
Gantt chart software can help crop scientists in their research projects by providing a visual representation of project timelines and tasks. It allows for better planning and scheduling of experiments, enabling researchers to allocate resources effectively and track progress. Additionally, Gantt charts help identify potential bottlenecks and dependencies, facilitating efficient collaboration and communication among team members.
Yes, Gantt Chart software can help crop scientists track and manage multiple experiments and field trials simultaneously by providing a visual representation of the project timeline, tasks, and dependencies. It allows for the allocation of resources, tracking of progress, identification of potential scheduling conflicts, and facilitates communication and collaboration among team members. This enables more efficient project management and decision-making in crop research and field trials.
Gantt chart software can assist crop scientists in optimizing project timelines and resource allocation by providing a visual representation of tasks and their dependencies. This allows for better coordination and prioritization of activities, ensuring efficient use of resources and timely completion of projects. Additionally, Gantt charts enable identification of potential bottlenecks and allow for adjustments to be made in real-time, resulting in improved project outcomes and increased productivity.