Stay ahead of every deadline.
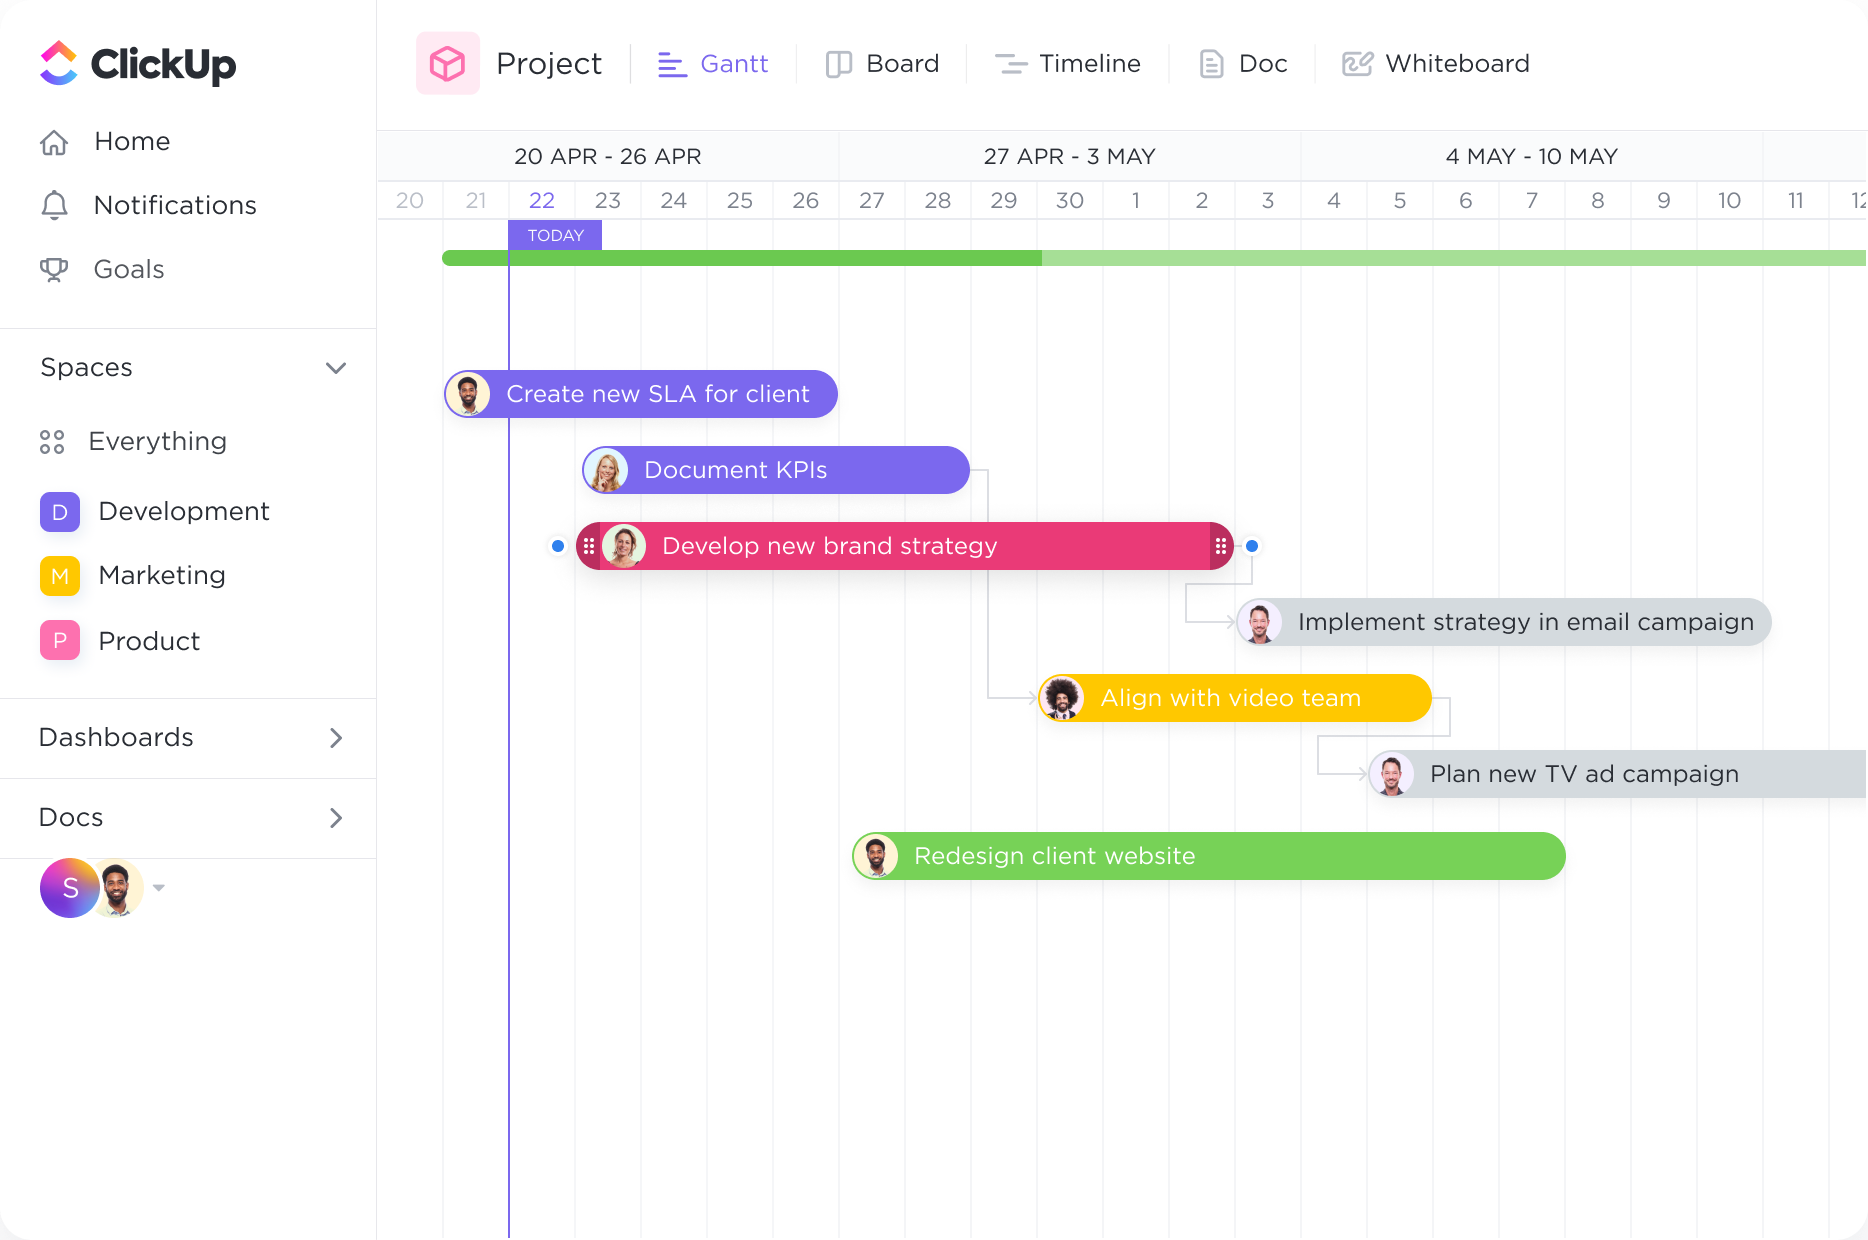
With the Gantt chart's dynamic timeline, you can easily schedule tasks, keep up with project progress, manage deadlines, and handle bottlenecks.
Supercharge your project management with ClickUp's powerful Gantt Chart software. Seamlessly plan and track your charitable foundation's initiatives with precision and efficiency. Visualize your project timelines, allocate resources, and ensure smooth coordination across teams, all in one intuitive platform. Take your organization's productivity to new heights with ClickUp's tailored Gantt Charts for charitable foundations.
Free forever.
No credit card.

Trusted by the world’s leading businesses
With the Gantt chart's dynamic timeline, you can easily schedule tasks, keep up with project progress, manage deadlines, and handle bottlenecks.
Get a bird's-eye view of all Spaces, Projects, Lists, and tasks in one Gantt chart. With clear coloring options, you can easily see what work is happening and where.

Gantt charts are invaluable tools for project management within charitable foundations. They allow you to visualize project timelines, deadlines, and milestones, ensuring that all team members have a clear understanding of the project's progress. By breaking down complex projects into smaller, manageable tasks, Gantt charts help you stay organized and ensure that projects are completed on time.
Charitable foundations often have limited resources, including personnel, funding, and equipment. Gantt charts enable you to effectively allocate and optimize these resources by providing a clear overview of their availability and usage. This helps you avoid overloading team members, prevent resource conflicts, and ensure that resources are utilized efficiently to maximize the impact of your charitable initiatives.
Fundraising campaigns are a crucial aspect of charitable foundations. Gantt charts can be used to plan and monitor all stages of a fundraising campaign, from initial strategy development to execution and evaluation. By visualizing tasks such as donor outreach, event planning, marketing efforts, and follow-up activities, Gantt charts help you stay on track and ensure the success of your fundraising initiatives.
Volunteers play a vital role in charitable foundations, and managing their tasks and schedules can be challenging. Gantt charts provide a centralized platform for allocating tasks among volunteers, ensuring that everyone is aware of their responsibilities and deadlines. This promotes effective collaboration, prevents task duplication, and allows you to track the progress of volunteer-driven projects.
Charitable foundations need to measure and report on the impact of their initiatives to donors, stakeholders, and the public. Gantt charts can be used to track and visualize the progress of projects and programs, making it easier to assess their effectiveness and report on key milestones and outcomes. This helps you demonstrate the value of your work and make data-driven decisions to improve future initiatives.
You can use Gantt chart software to visualize and track the progress of multiple projects simultaneously. It enables you to allocate resources effectively, identify potential scheduling conflicts, and manage project dependencies. This improves coordination, efficiency, and decision-making across your charitable foundation's projects, ensuring timely completion and successful outcomes.
Yes, Gantt chart software allows you to track the progress of tasks and milestones in real-time, providing a clear visual representation of the project's status and enabling timely adjustments and decision-making.
Gantt chart software offers features such as resource management, task dependencies, and timeline visualization to help you allocate resources effectively. It allows you to assign resources to specific tasks, track their availability, and adjust assignments as needed. By visualizing project timelines, you can identify potential resource conflicts and make necessary adjustments to ensure timely completion of projects for your charitable foundation.