Manage all of your projects in one place.
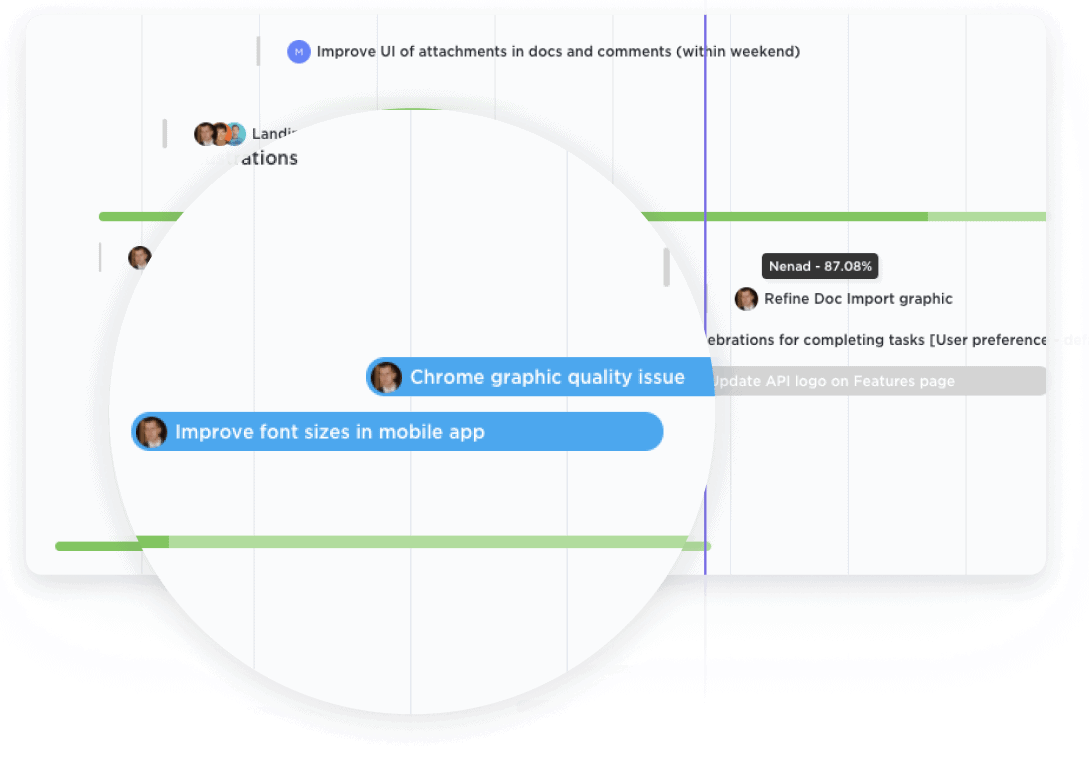
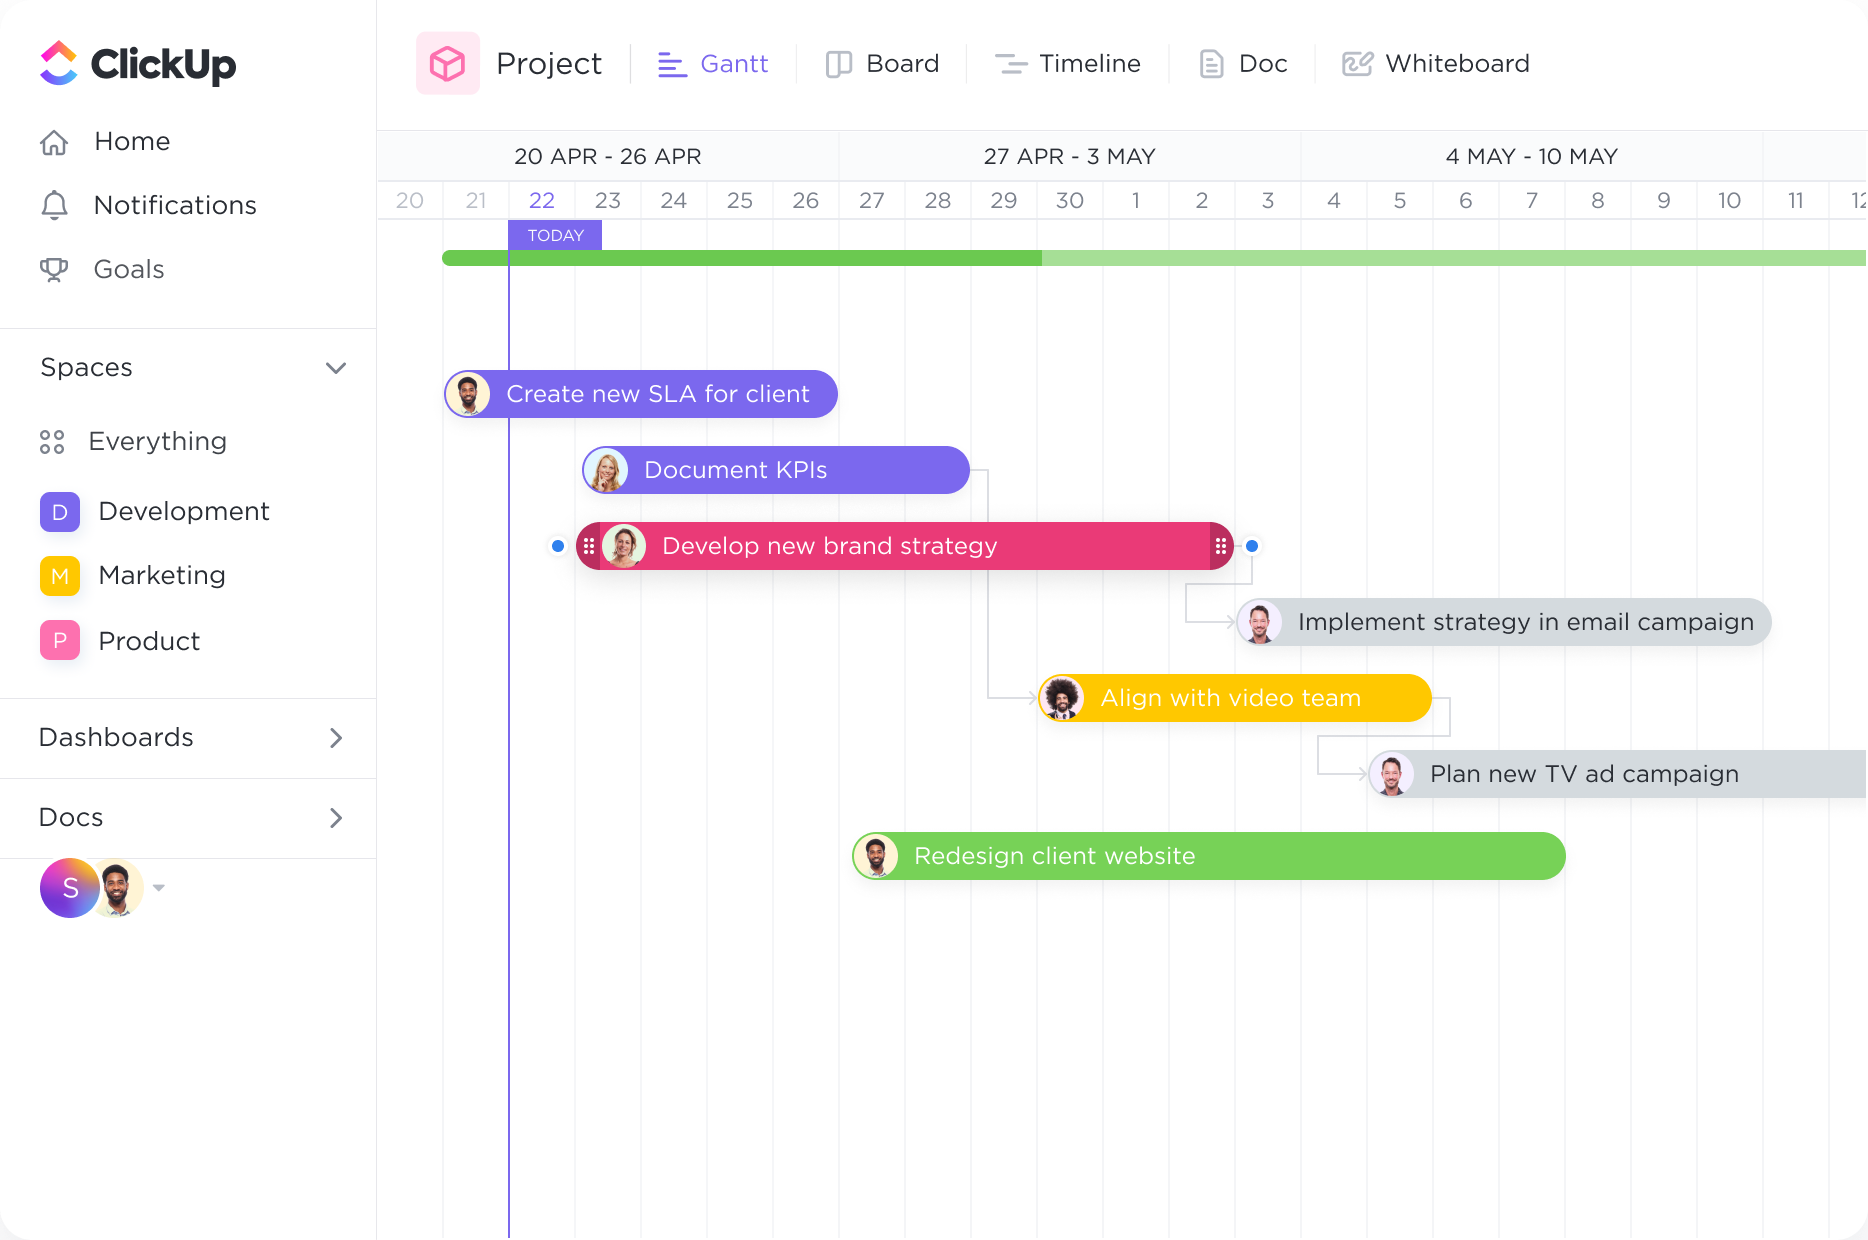
Get a bird's-eye view of all Spaces, Projects, Lists, and tasks in one Gantt chart. With clear coloring options, you can easily see what work is happening and where.

Supercharge your project management with ClickUp's Gantt Chart software, designed specifically for advertisers. Streamline your campaigns, track progress, and meet deadlines seamlessly with our intuitive interface. Visualize your projects, allocate resources, and monitor team performance all in one place. Stay ahead of the competition and achieve advertising success with ClickUp's powerful Gantt Chart software.
Free forever.
No credit card.

Trusted by the world’s leading businesses
Get a bird's-eye view of all Spaces, Projects, Lists, and tasks in one Gantt chart. With clear coloring options, you can easily see what work is happening and where.

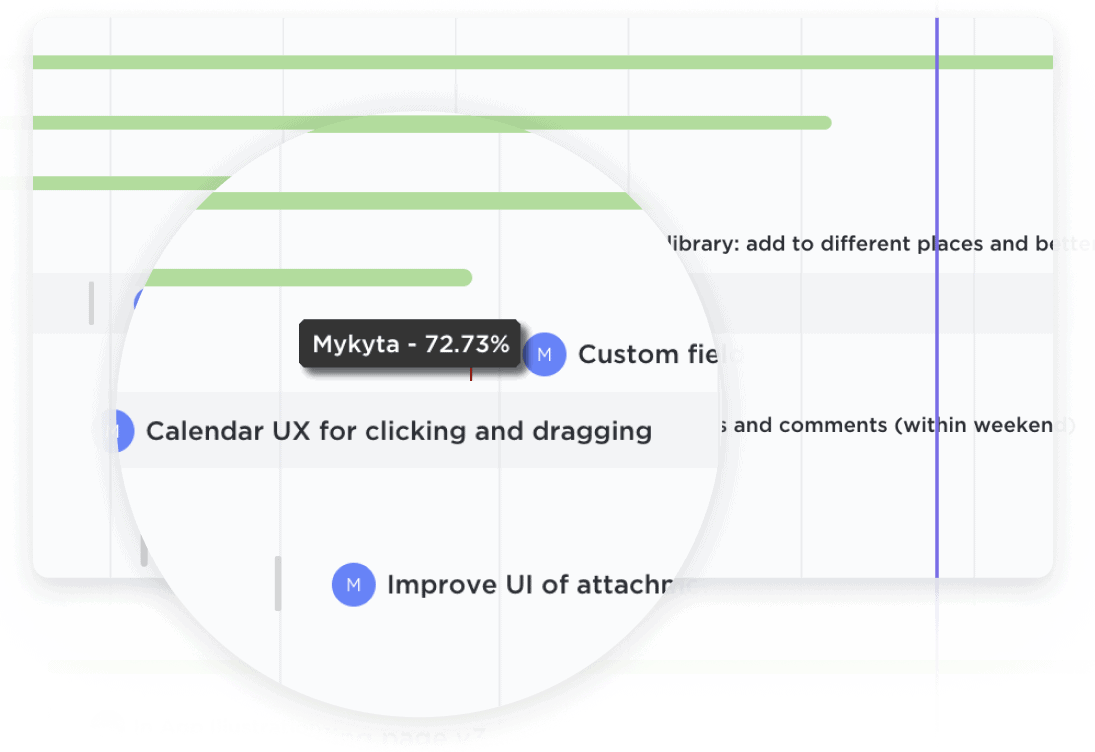
Easily update projects with a simple drag-and-drop action to collaborate amongst your team in real-time. Dynamic progress percentages provide a detailed snapshot.

Gantt charts are invaluable tools for advertisers when it comes to planning and executing marketing campaigns. By visualizing the entire campaign timeline, including tasks, milestones, and deadlines, advertisers can effectively coordinate their efforts and ensure that all components of the campaign are executed in a timely manner. Gantt charts help to identify dependencies between tasks, allocate resources, and track progress, ultimately improving the efficiency and effectiveness of the advertising campaign.
For advertisers involved in media buying and placement, Gantt charts can be used to manage and optimize the process. By mapping out the schedules for media placements, including TV ads, radio spots, online banners, and print advertisements, advertisers can ensure that their ads are strategically placed at the right times and in the right media channels. Gantt charts help advertisers track the status of media placements, avoid conflicts or overlaps, and make informed decisions about budget allocation.
The creative production process in advertising involves multiple stages, from concept development to final production. Gantt charts can be used to plan and monitor each stage of the creative production workflow, including ideation, storyboarding, scriptwriting, casting, shooting, editing, and post-production. By visualizing the timeline and dependencies between tasks, advertisers can ensure that the creative process stays on track, deadlines are met, and the final product is delivered on time.
Gantt charts can also be utilized by advertisers to track and report on the performance of their advertising campaigns. By incorporating key performance indicators (KPIs) and milestones into the Gantt chart, advertisers can monitor the progress of the campaign, track the achievement of specific goals, and generate reports to evaluate the success of their advertising efforts. Gantt charts provide a clear overview of campaign performance, allowing advertisers to make data-driven decisions and optimize future campaigns based on insights gained.
You can utilize Gantt chart software to create a visual representation of your advertising campaign timeline, tasks, and dependencies. This enables you to allocate resources effectively, track progress, and identify potential bottlenecks or delays. By having a clear overview of the campaign's milestones and deadlines, you can ensure timely execution, enhance collaboration among team members, and make informed decisions to optimize your advertising efforts.
Gantt chart software offers advertisers a visual representation of their campaign timelines, allowing them to plan and schedule tasks effectively. It facilitates the allocation of resources and budget, enables tracking of deliverables and deadlines, and highlights dependencies and critical paths. Additionally, it enhances collaboration and communication among team members, ensuring a streamlined workflow and efficient project management for advertising campaigns.
Gantt chart software has helped advertisers improve project management and campaign execution processes by providing a visual representation of tasks and timelines. This allows for better coordination and allocation of resources, ensuring that all campaign elements are executed on time. It also helps identify potential bottlenecks and allows for quick adjustments to optimize campaign performance.