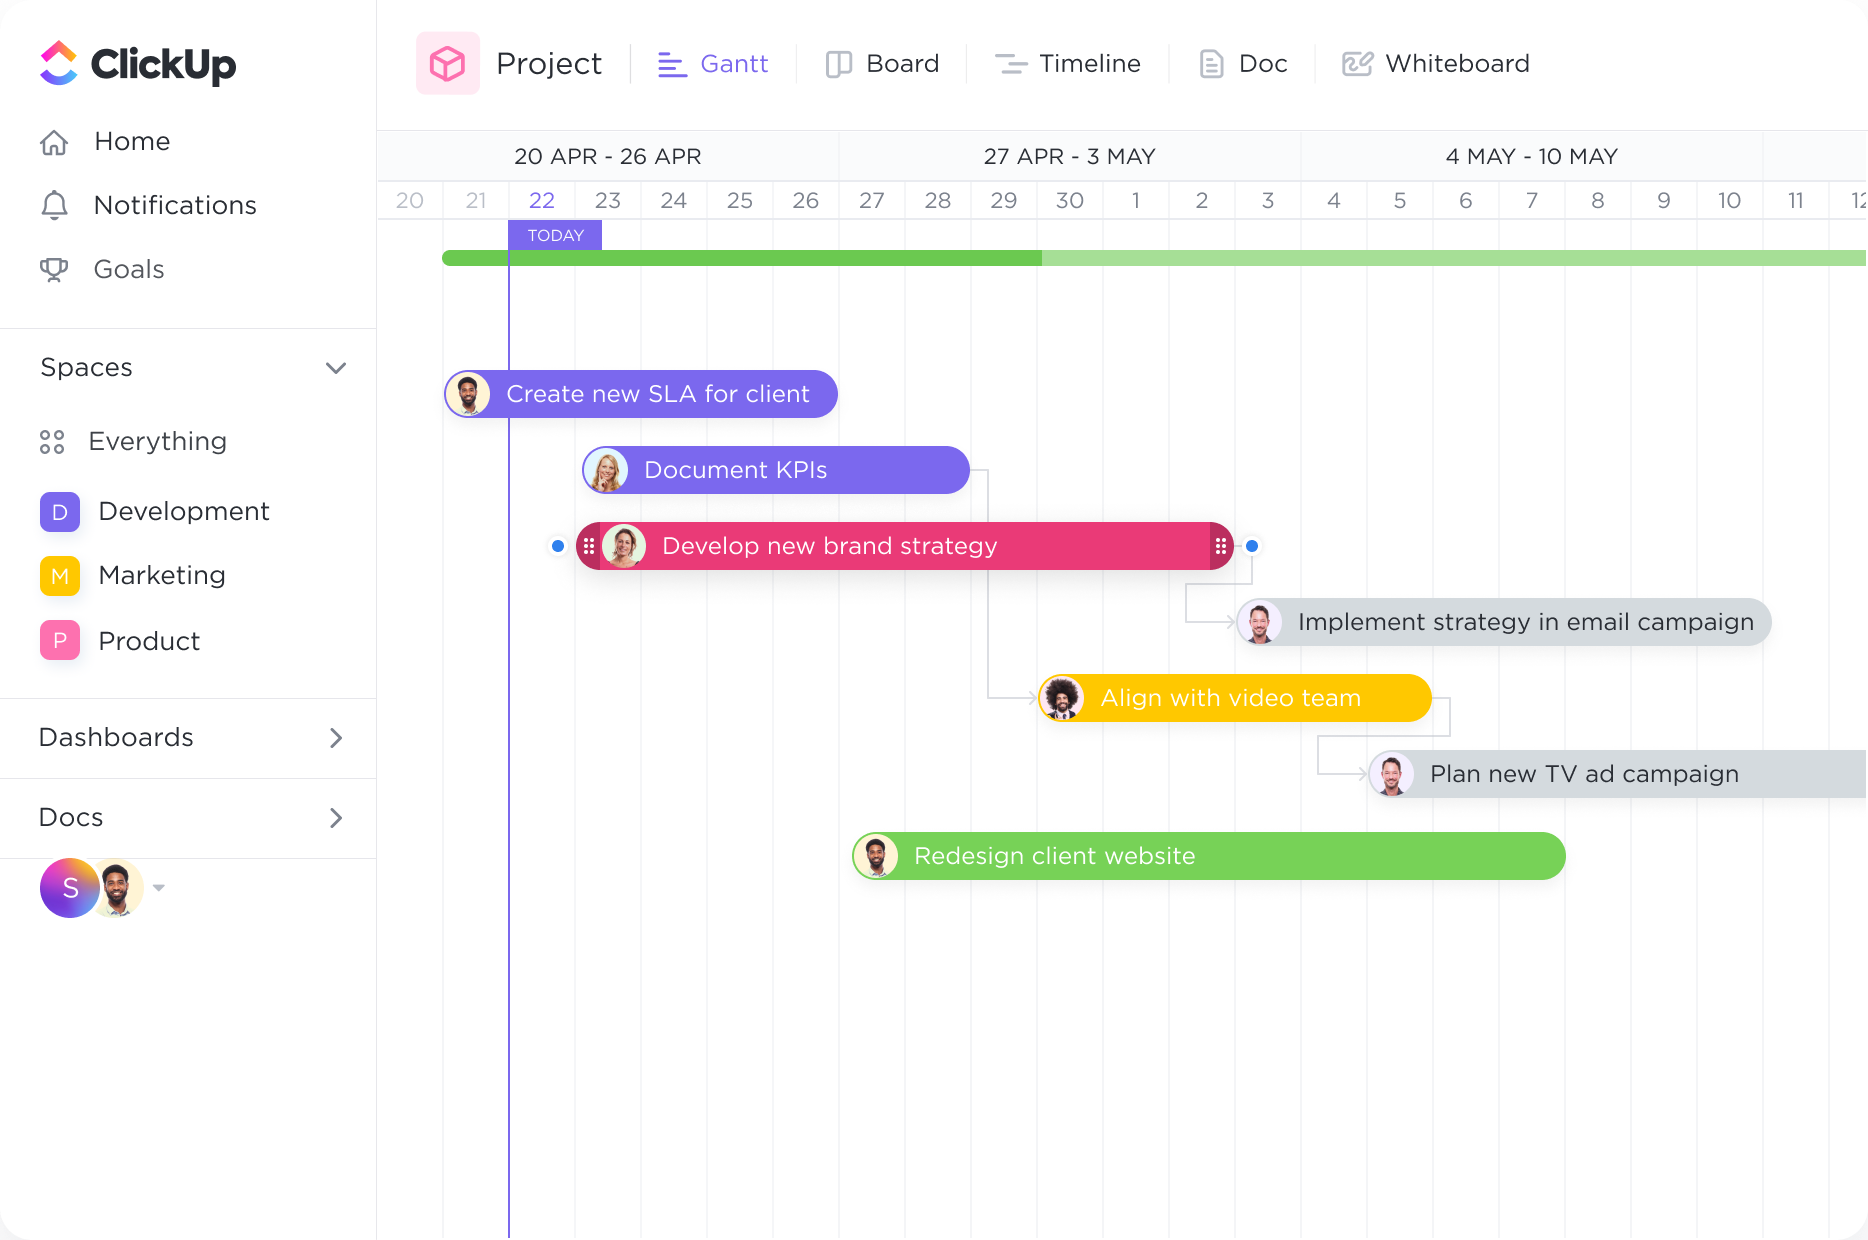
Eliminate bottlenecks before they happen.
Intelligent dependency-path tracking shows you where potential bottlenecks might exist to prevent inefficiencies.
Supercharge your project management with ClickUp's Gantt Chart software designed specifically for Administrators. Streamline your workflow, track progress, and assign tasks effortlessly with this powerful tool. ClickUp's intuitive interface and customizable features make it the ideal choice for Administrators looking to stay organized and increase productivity. Take control of your projects like never before with ClickUp's Gantt Chart software designed with you in mind.
Free forever.
No credit card.

Trusted by the world’s leading businesses
Intelligent dependency-path tracking shows you where potential bottlenecks might exist to prevent inefficiencies.
Create tasks and link them with dependencies. Dragging a task with dependencies will automatically reschedule tasks in the chain
Administrators often have multiple projects and tasks to manage simultaneously. Gantt charts provide a comprehensive overview of project timelines, deadlines, and milestones, allowing administrators to effectively plan and allocate resources. By visualizing the project's progress, administrators can track tasks, identify bottlenecks, and make informed decisions to ensure projects stay on track.
Administrators play a crucial role in coordinating and managing teams. Gantt charts enable administrators to assign tasks to team members, set dependencies, and track progress collectively. This promotes effective collaboration, ensures everyone is aware of their responsibilities, and allows administrators to monitor the overall progress of the team.
Efficient resource allocation is essential for administrators to optimize productivity. Gantt charts provide a clear picture of resource availability and utilization, allowing administrators to allocate personnel, equipment, and other resources effectively. By identifying resource gaps or conflicts in advance, administrators can make adjustments to ensure smooth operations and avoid delays.
Administrators often handle event planning, from small meetings to large conferences. Gantt charts help administrators outline the schedule for event preparation, execution, and wrap-up activities. By visualizing tasks and deadlines, administrators can coordinate with various stakeholders, manage vendors, and ensure all necessary arrangements are made to deliver a successful event.
Administrators face numerous tasks and responsibilities on a daily basis. Gantt charts provide a visual representation of tasks, their dependencies, and deadlines, allowing administrators to prioritize effectively. By identifying critical tasks and allocating time accordingly, administrators can manage their workload efficiently, meet deadlines, and ensure important tasks are not overlooked.
Key features of Gantt chart software include visual project timelines, task dependencies, resource allocation, progress tracking, and collaboration tools. These features enable administrators to plan and schedule tasks, monitor project progress, identify bottlenecks, allocate resources efficiently, and facilitate communication among team members, resulting in effective project management.
Yes, Gantt chart software can integrate with other project management tools commonly used by administrators. Integration allows for seamless data transfer between different tools, ensuring that project information and updates are synchronized across platforms. This enables administrators to centralize project data, streamline communication, and improve collaboration among team members using different tools.
Gantt chart software can help administrators track and manage resource allocation in a project by providing a visual representation of the project timeline and tasks. This allows administrators to see which resources are assigned to each task and identify any potential conflicts or bottlenecks. They can easily adjust resource assignments and timelines as needed to optimize resource utilization and ensure that tasks are completed on time.