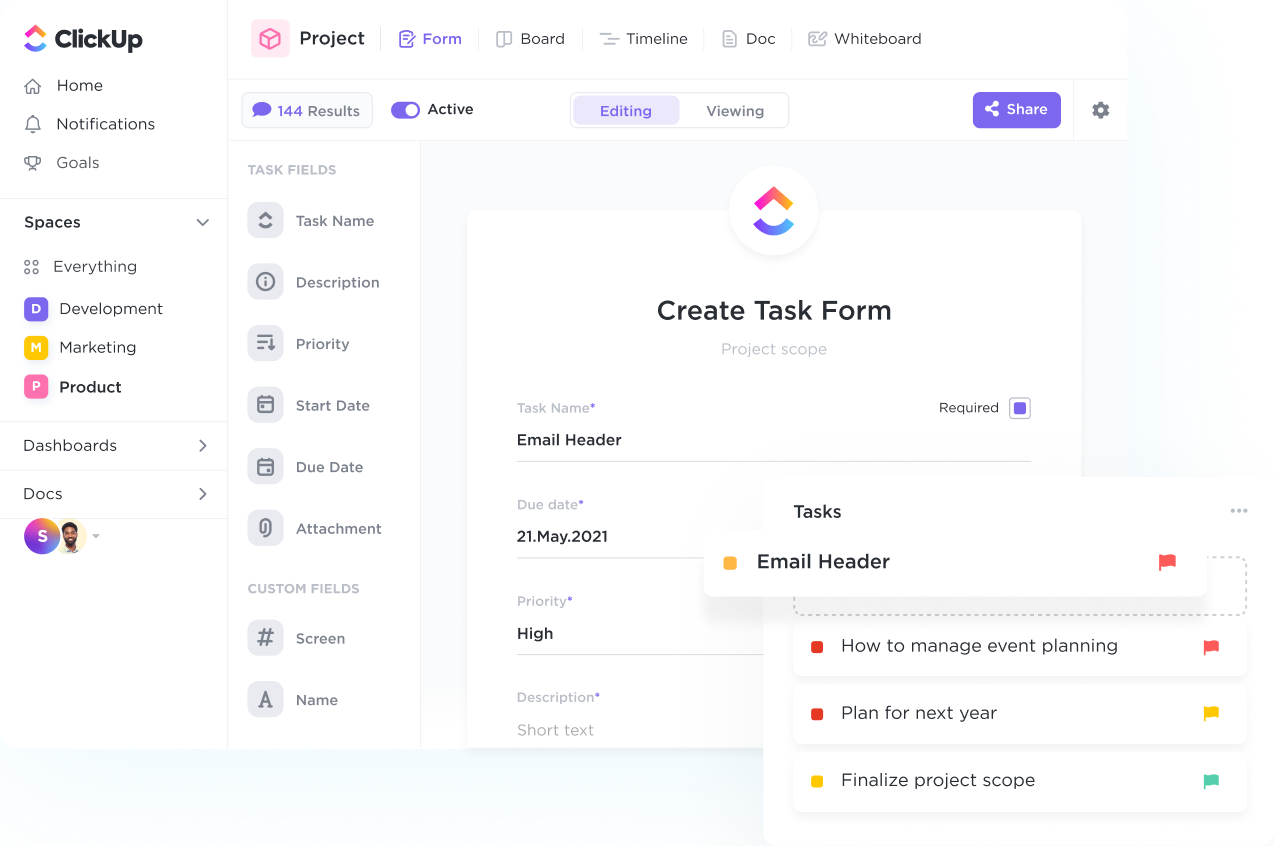
Onboard customers and collect info in a snap.
Streamline your intake process, organize response data, and automatically create tasks with custom branded Forms powered by conditional logic.

Optimize your workflow and supercharge your productivity with ClickUp's CRM system designed specifically for Stock Market Analysts. Streamline your client interactions, track leads, and manage your deals effortlessly all in one place. Say goodbye to scattered data and missed opportunities - ClickUp empowers you to stay organized and focused on growing your business. Try ClickUp's tailored CRM solution today and take your stock market analysis to the next level.
Free forever.
No credit card.
Trusted by the world’s leading businesses
Streamline your intake process, organize response data, and automatically create tasks with custom branded Forms powered by conditional logic.

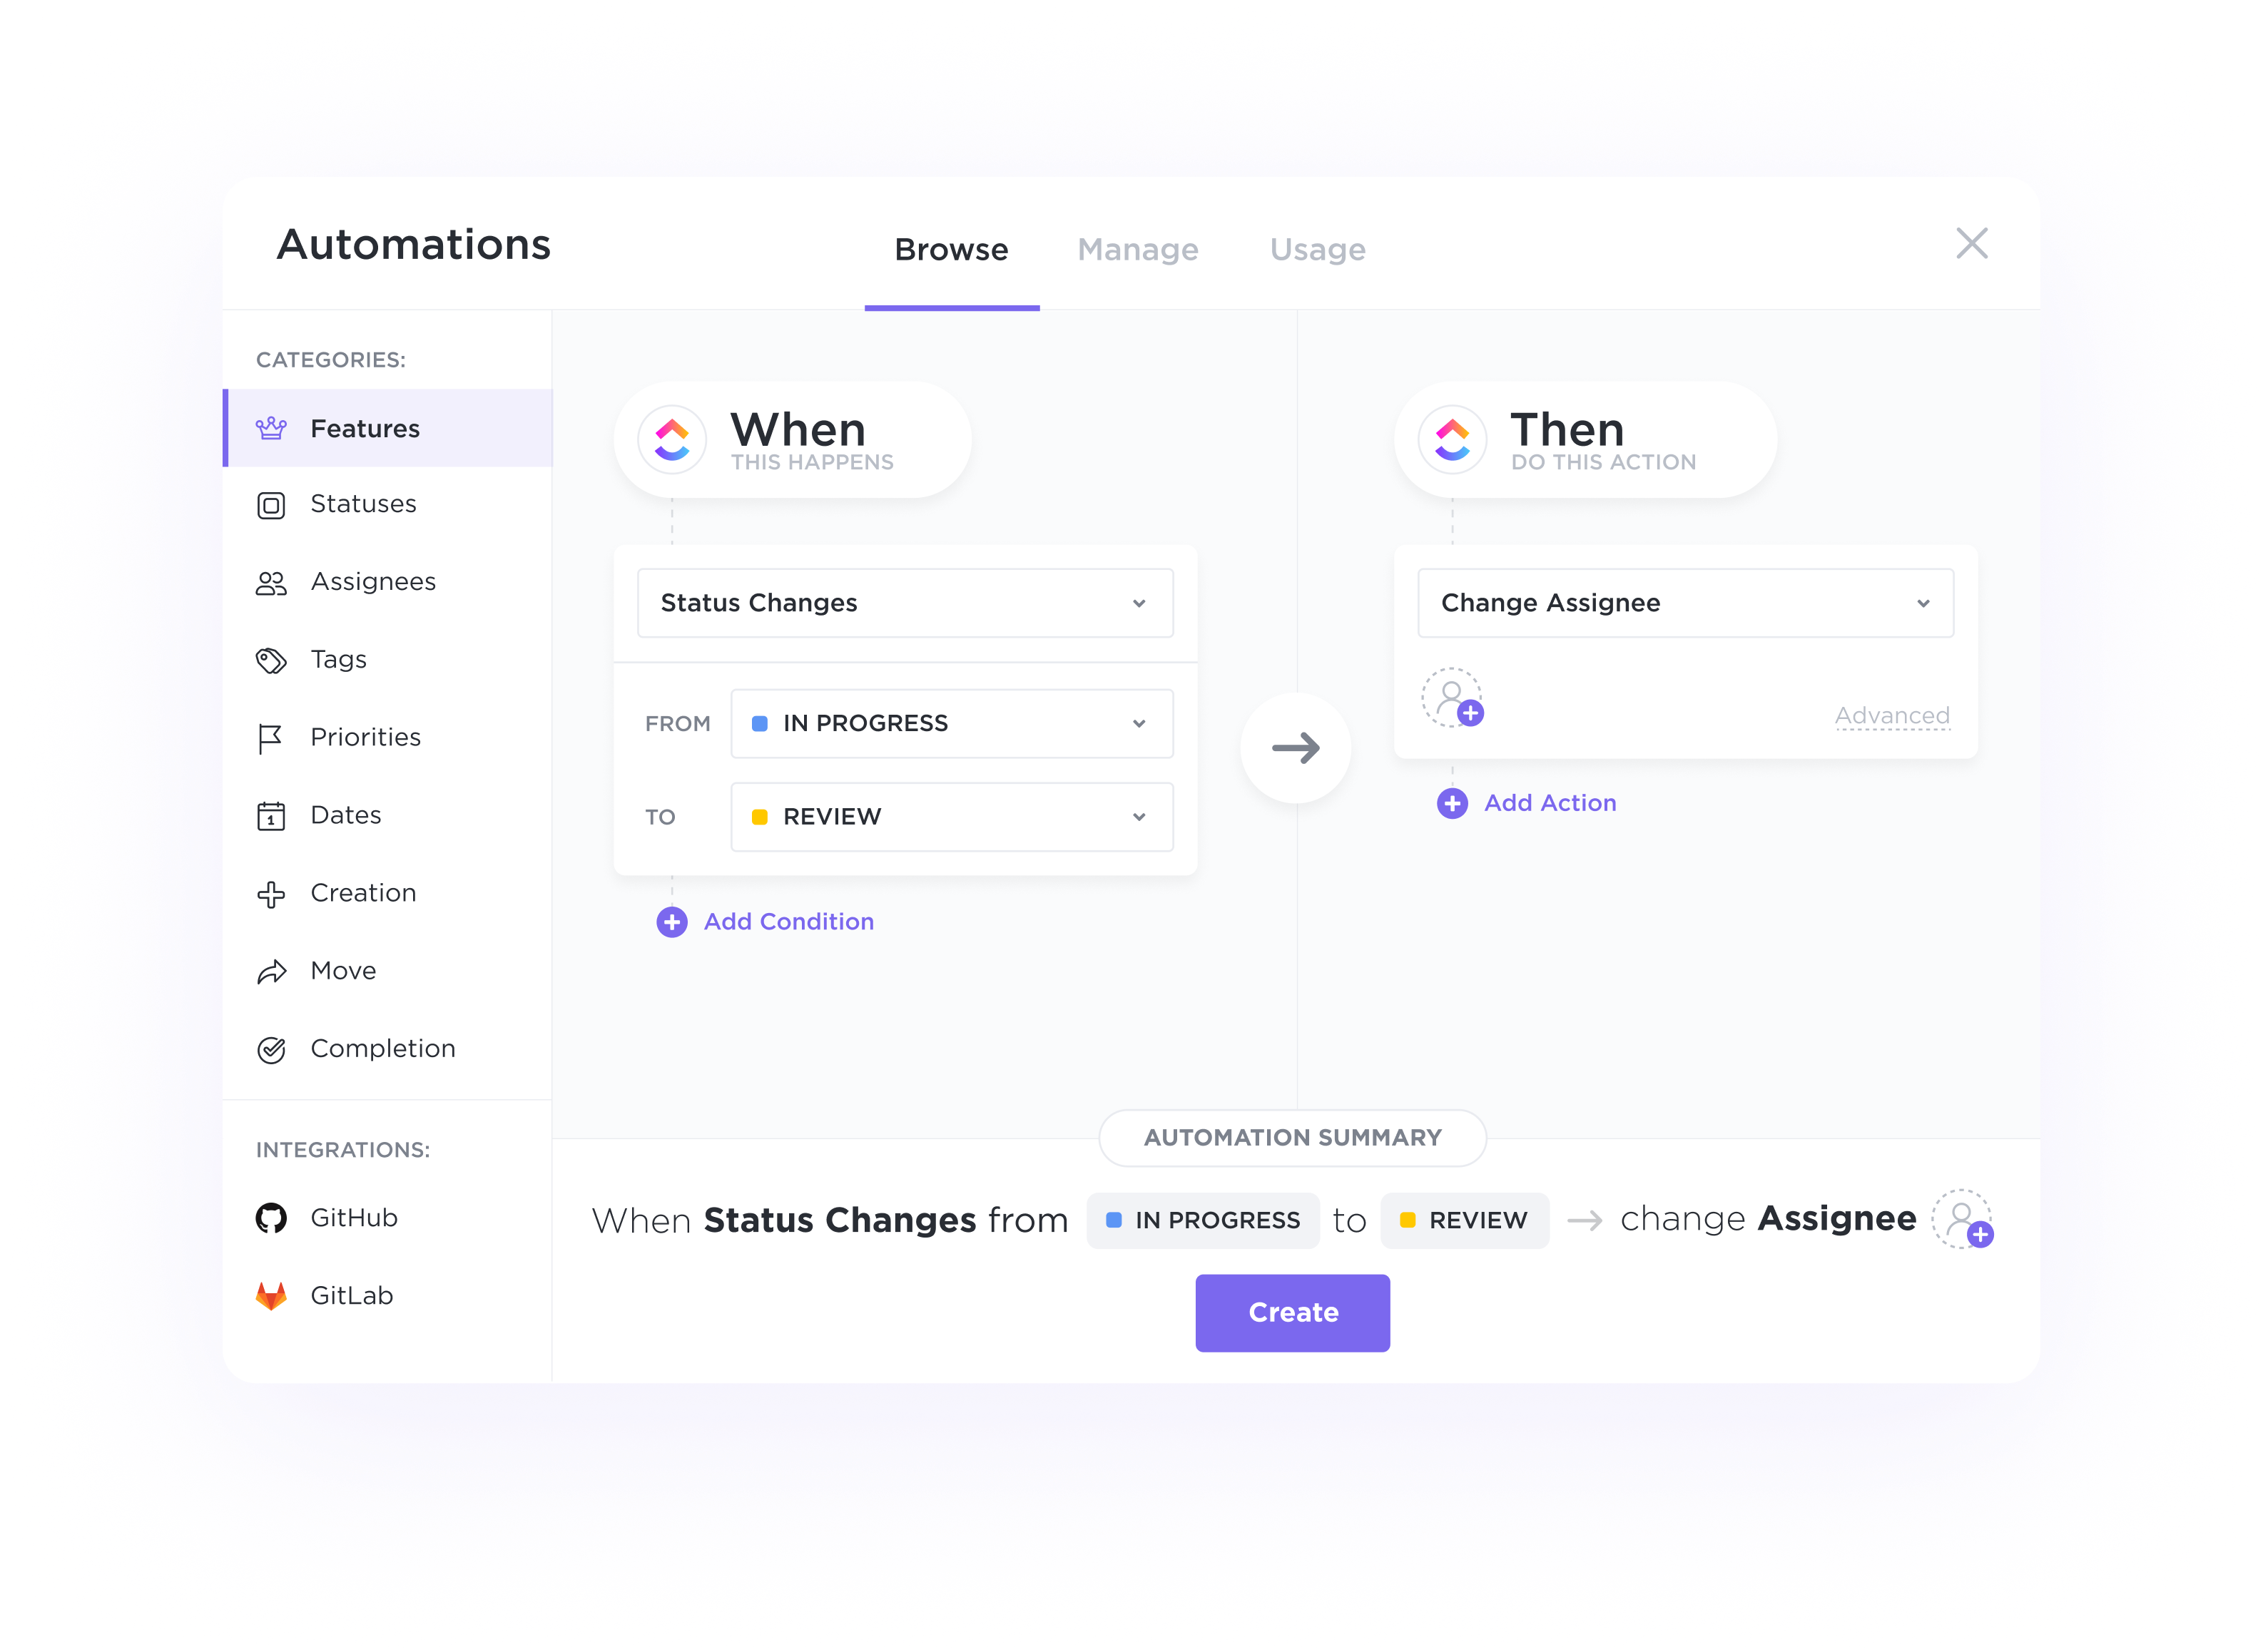
Automatically assign tasks for each stage of your pipeline, trigger status updates based on activity, and switch priorities to alert your team on where to focus next.

As a stock market analyst, using a CRM tool can help you efficiently capture and manage leads from various sources such as investment forums, newsletters, or networking events. By scoring leads based on criteria like investment preferences or risk tolerance, you can prioritize your outreach efforts and nurture leads through the investment decision-making process.
Managing your investment opportunities through a CRM tool provides a visual representation of where each potential investment stands in your analysis and decision-making process. This helps you focus on high-potential investments, track progress, and ensure timely follow-ups, ultimately improving your efficiency in managing a diverse portfolio of investments.
Utilizing a CRM for customer analytics as a stock market analyst enables you to track and analyze how investors interact with your investment recommendations or services. By understanding investor behavior and preferences, you can tailor your investment strategies, improve client retention, and identify opportunities for personalized investment offerings.
In the fast-paced world of stock market analysis, automating repetitive tasks and workflows through a CRM tool can significantly enhance your productivity. From sending timely investment reports to setting up alerts for market changes or client meetings, workflow automation streamlines your daily operations, allowing you to focus more on in-depth analysis and decision-making.
CRM software helps stock market analysts manage client relationships effectively by organizing client data, tracking interactions, and providing insights that enable personalized communication, timely follow-ups, and tailored investment recommendations, ultimately enhancing client satisfaction and retention.
CRM software offers features like advanced analytics, real-time data tracking, customizable dashboards, and integration with market data sources to assist stock market analysts in tracking and analyzing market trends effectively.
Yes, CRM software can integrate with tools commonly used by stock market analysts, such as trading platforms or financial data providers, to streamline data sharing, enhance collaboration, and provide a more comprehensive view of client interactions and financial information.