Master Agile Progress with AI Burndown Chart Generator
Understanding the AI Burndown Chart Generator
An AI Burndown Chart Generator automates sprint tracking by visually representing remaining work against time, enabling Agile teams to spot bottlenecks and adjust plans proactively.
Traditionally, creating burndown charts involves manual data entry into spreadsheets or specialized tools, which can be prone to delays and inaccuracies.
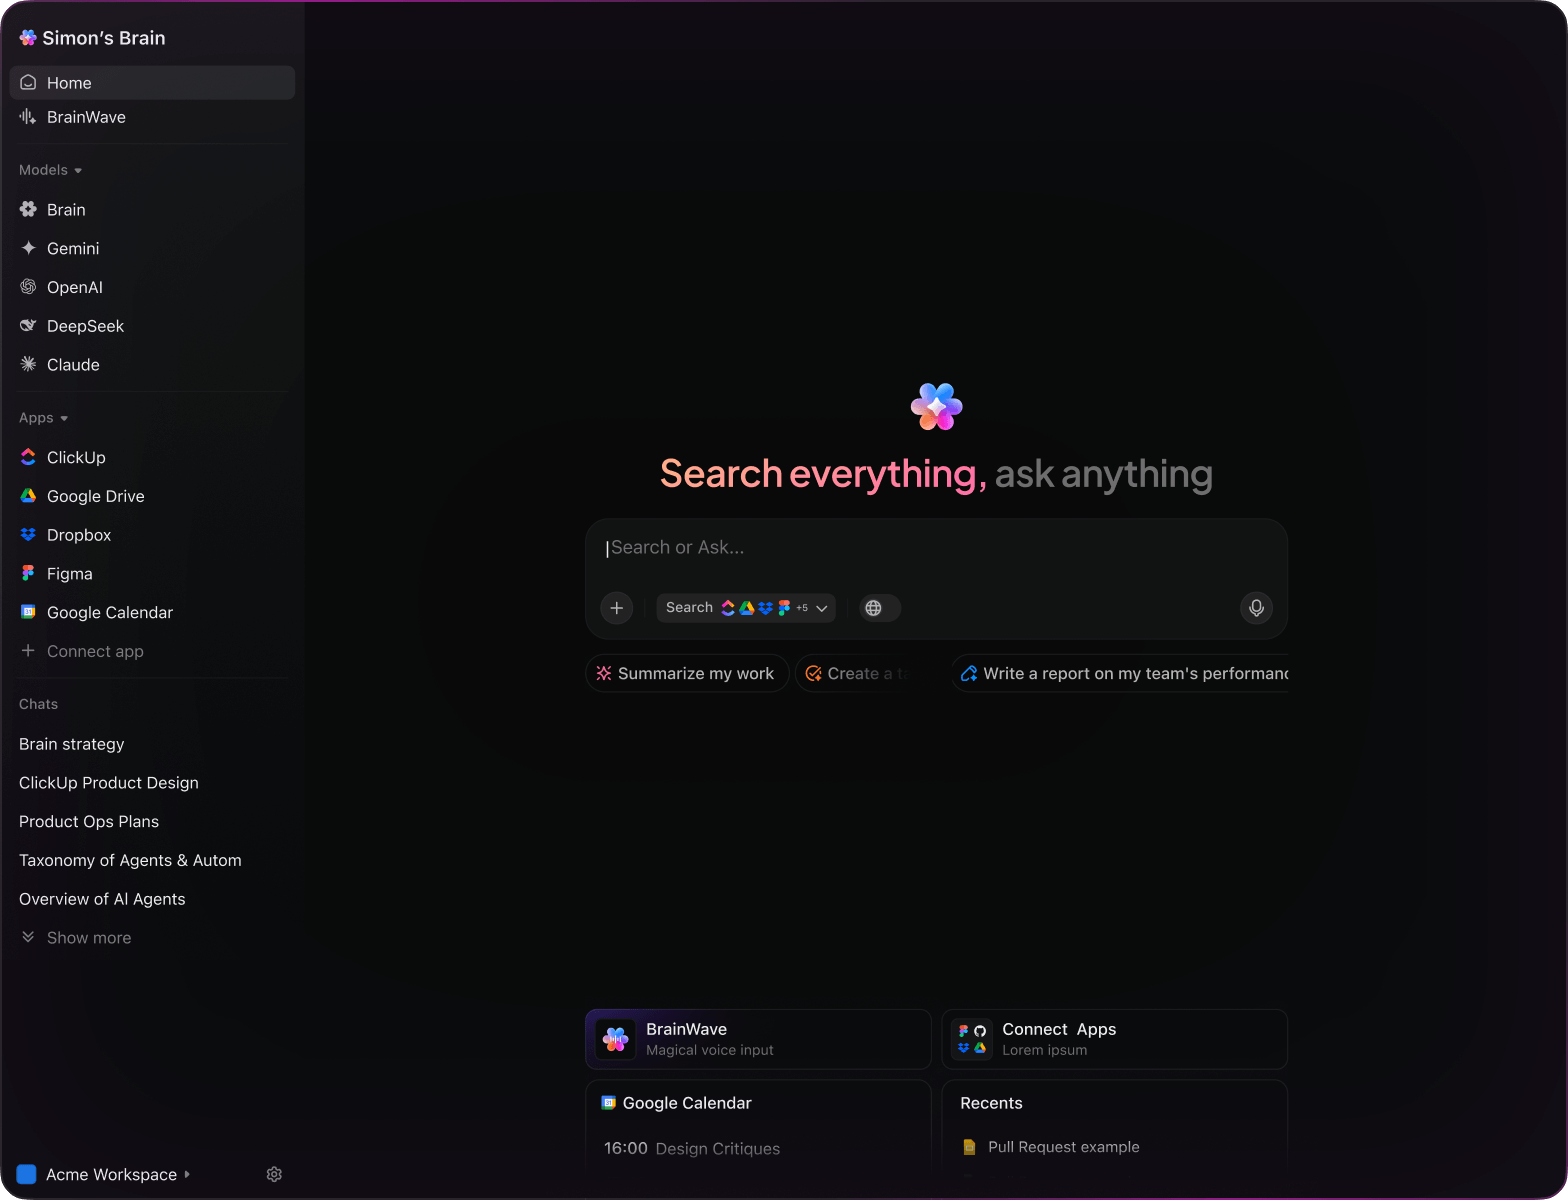
By integrating AI, especially through ClickUp Brain, you can generate dynamic, real-time burndown charts that reflect actual task completion and sprint velocity. Simply instruct the AI, "Show me the burndown chart for Sprint 12," and instantly get an accurate, live view of your Agile progress.
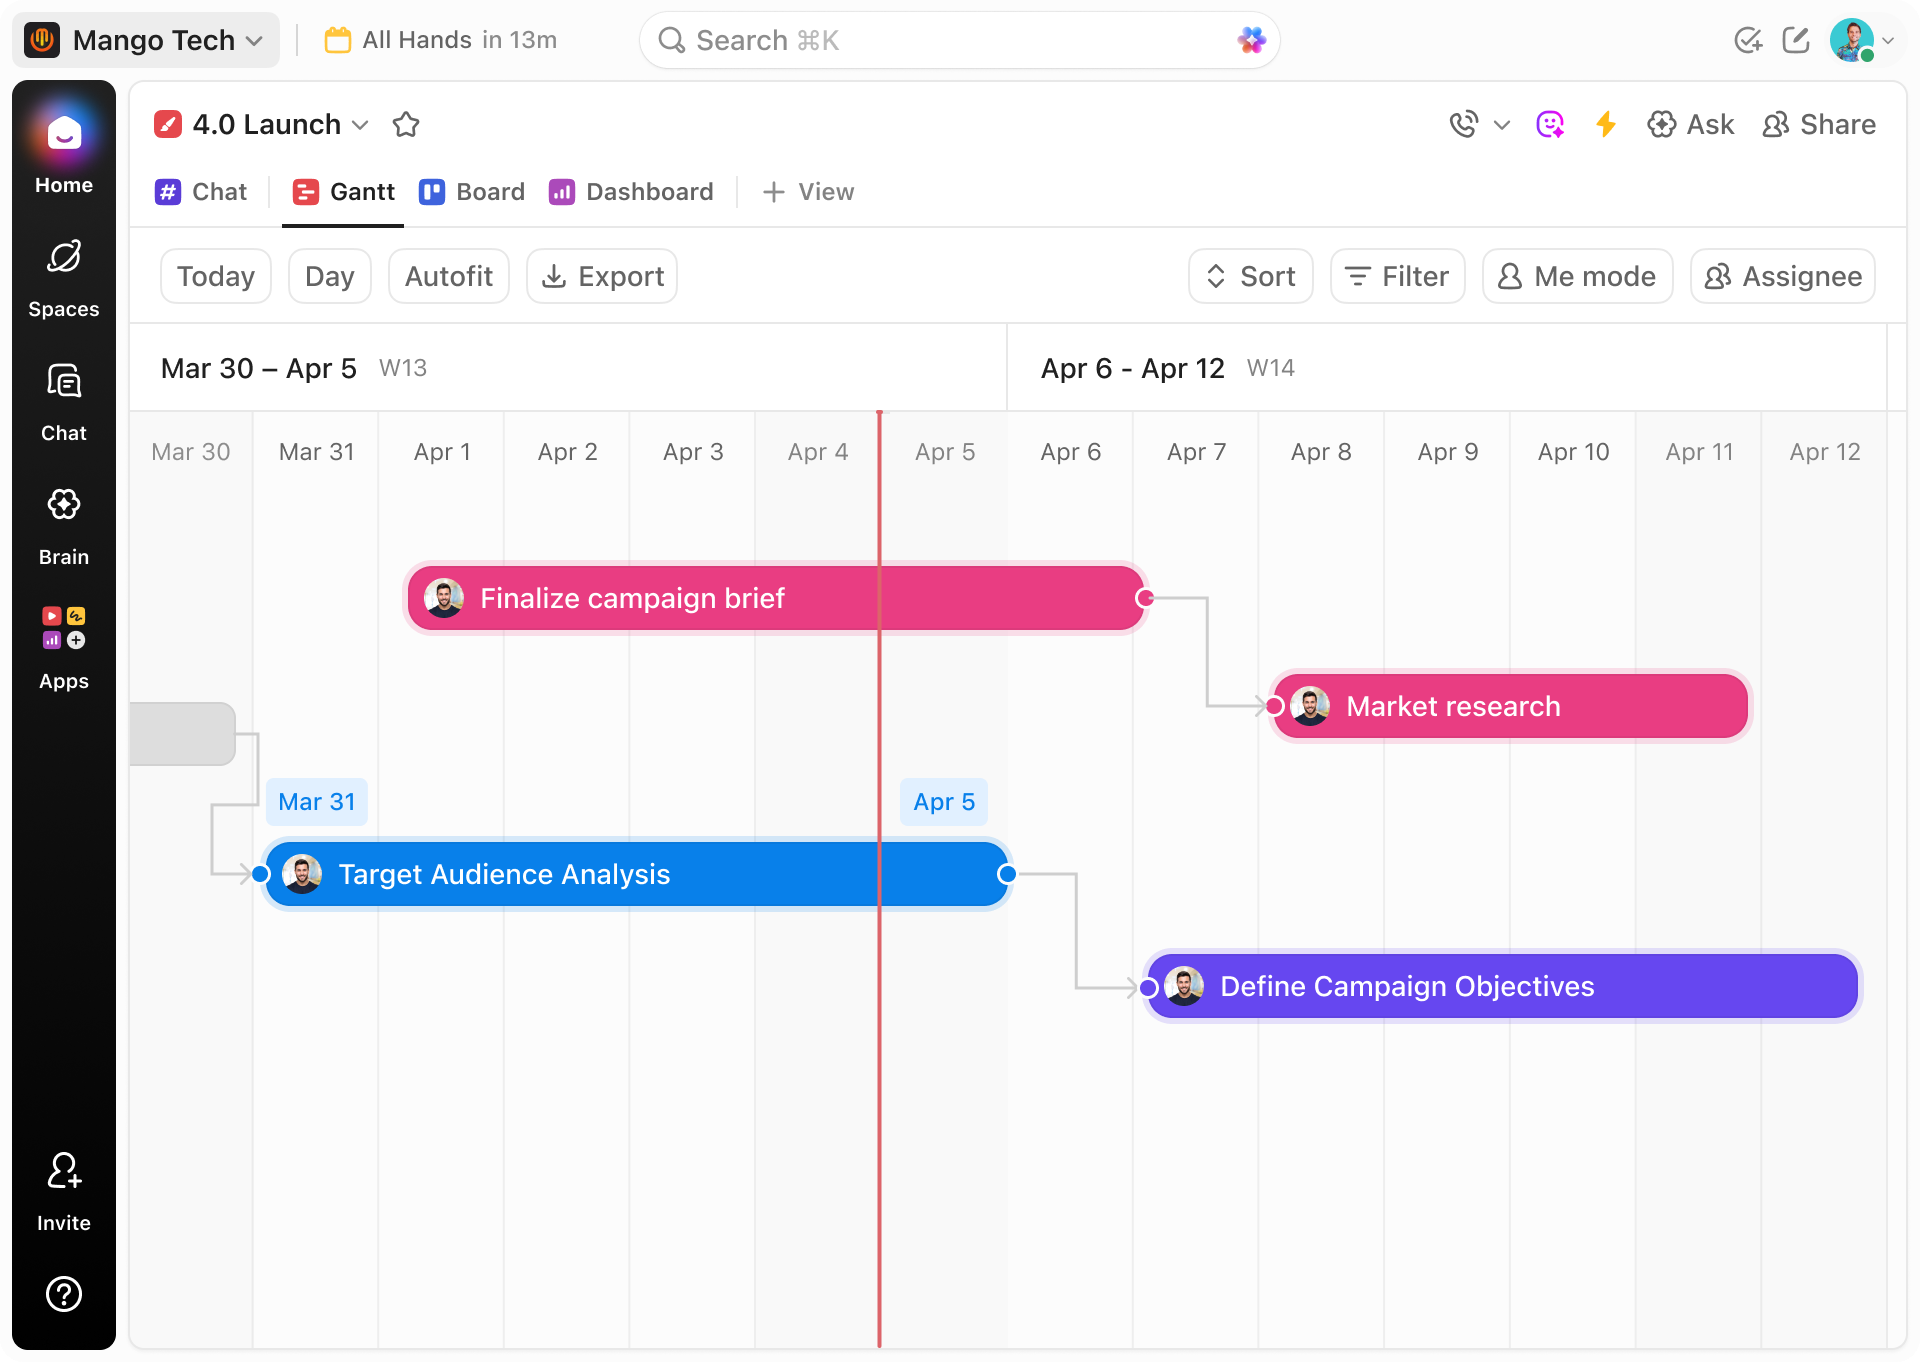
Embedded within ClickUp, these charts are interactive and update automatically as your team completes tasks, making sprint monitoring intuitive and actionable.
How ClickUp AI Burndown Chart Stands Apart
Traditional Burndown Chart Tools
- Manual Updates: Requires constant input of task progress and story points.
- Static Visuals: Charts often exported as images or PDFs, limiting collaboration.
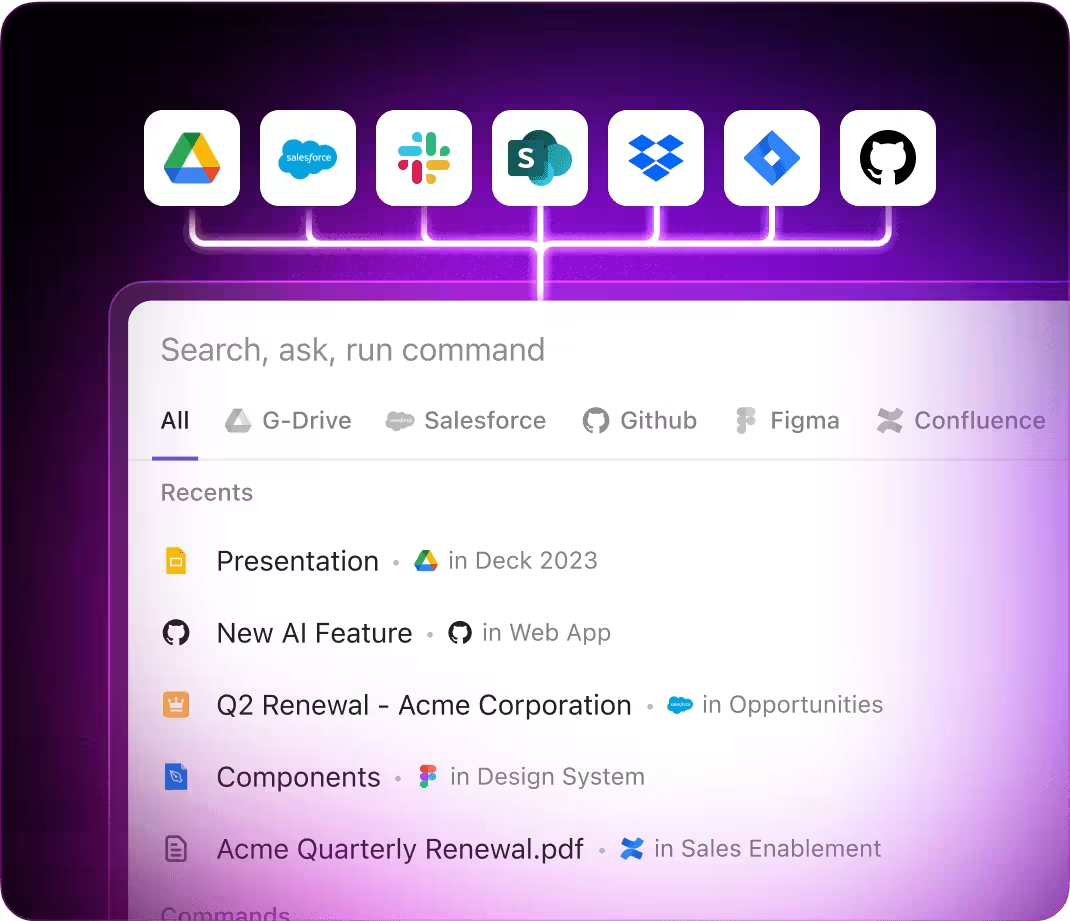
- Fragmented Data: Information scattered across tools, causing delays.
- Lack of Context: No integration with task dependencies or team dynamics.
- Limited Forecasting: Relies on historical data without adaptive insights.
ClickUp Brain AI Burndown Generator
- Workflow Embedded: Generates charts directly from your ClickUp tasks and sprints.
- Live Updating: Reflects task completion and blockers instantly.
- Context-Aware: Considers dependencies, priorities, and team input.
- Collaborative: Teams can comment and adjust sprint scope in real time.
- Predictive Insights: Uses AI to forecast sprint outcomes and suggest adjustments.
How to Generate an AI-Powered Burndown Chart
1. Sync Your Sprint Data in ClickUp
Traditional approach: Collect sprint tasks, story points, and statuses manually from multiple sources.
With ClickUp Brain:
Your sprint backlog, task statuses, and story points are automatically synced. Just specify: "Display burndown chart for Sprint 5."
2. Let AI Analyze Progress and Dependencies
Traditional approach: Manually calculate remaining work and update charts daily.
With ClickUp Brain:
AI reviews task completion, dependencies, and blockers to provide an accurate burn rate and progress forecast.
3. Customize Chart to Match Your Sprint Style
Traditional approach: Use fixed chart templates with limited flexibility.
With ClickUp Brain:
Tailor your burndown charts with filters for teams, story types, or sprint goals using intuitive controls and AI suggestions.
4. Monitor and Adjust in Real Time
Traditional approach: Update charts manually after daily standups or status meetings.
With ClickUp Brain:
Charts auto-update as your team completes tasks or shifts priorities, keeping everyone aligned without extra effort.
3 Impactful Uses for AI Burndown Chart Generator
Accelerate Sprint Planning and Forecasting
Product owners and Scrum Masters leverage AI-generated burndown charts to visualize sprint capacity and adjust scope dynamically.
This real-time insight supports proactive decision-making and smoother sprint deliveries.
Identify and Resolve Sprint Blockers Early
Agile teams use AI insights to detect deviations from expected burn rates, highlighting blockers and risks.
Early detection enables swift interventions, minimizing sprint disruptions.
Enhance Stakeholder Transparency and Reporting
Scrum teams share AI-generated burndown charts with stakeholders for clear, up-to-date sprint status.
This fosters trust and keeps everyone aligned on progress and challenges.
