تتطلب الإدارة الفعالة للمشروع تخطيطًا دقيقًا وجدولة وتتبع التقدم الفعلي، مع مراقبة الأهداف المحددة والمواعيد النهائية الملتزم بها عن كثب. وهذا أمر سهل عندما تتعامل مع مشروع صغير. ولكن إذا كنت تدير مبادرة واسعة النطاق - فأنت أمام وحش مشروع يجب ترويضه بأحدث الأسلحة المتطورة.
هذا هو الغرض من أدوات مثل مخططات جانت وخرائط الطريق! يمكنها أن تمنحك رؤى قيمة حول مشروعك، مما يساعدك على توجيه جميع أجزائه المتحركة في الاتجاه الصحيح وهزيمة الوحش دون خدش. 😏
من المفاهيم الخاطئة الشائعة (ونجرؤ على القول، غير العادلة تمامًا) أن مخططات جانت وخرائط الطريق هما نفس الشيء، ويرجع ذلك في المقام الأول لأنهما متشابهان في الشكل ويستخدمان كأدوات لتخطيط المشروع. لكن الحقيقة هي أن كل أداة تساعد على تصور العناصر الاستراتيجية للخطة بطرق فريدة من نوعها.
في هذه المقالة، سنقوم في هذه المقالة بالبحث في مخطط جانت مقابل خارطة الطريق أوجه التشابه والاختلاف وشرح حالات الاستخدام الأساسية لكل منهما، بالإضافة إلى كيفية ملاءمتهما لمنهجية أجايل. كما سنقترح أيضًا أدوات وقوالب مختلفة للاستفادة من كلتا تقنيتي التصور.
ما هو مخطط جانت؟
مخطط جانت هو مخطط جانت هو مخطط شائع مخطط إدارة المشروع الذي يصور المهام المتعلقة بمشروع معين في شكل مخطط شريطي سهل الاستخدام، وعادةً ما يكون أفقيًا. وهو يركز على تسلسل المهام والتبعيات على مدى فترة زمنية، ويمثل جدولاً خطيًا بمواعيد نهائية دقيقة وتدفق منظم لمهام معينة.

تصور أي مشروع وإدارته باستخدام مخططات جانت الخاصة ب ClickUp
قد تتساءل لماذا تحتاج إلى مخطط جانت بينما يمكنك الاحتفاظ بجميع المهام والمواعيد النهائية في قائمة أو جدول. في حين أن ذلك ممكن، إلا أن الغرض الحقيقي من مخطط جانت هو أن يكون بمثابة أداة للتفكير والتخطيط الاستراتيجي في إدارة المشاريع الاحترافية.
إن وضع عمل المشروع في مخطط شريطي يجعلك متقبلاً بصريًا. ونتيجةً لذلك، يمكنك ضبط خطتك الاستراتيجية بشكل أكثر كفاءة، وتحديد الأولويات والمخاطر والعوائق التي تعترض طريقك، والبقاء على المسار الصحيح نحو تحقيق الأهداف.
فيما يلي فوائد قيّمة أخرى ستستمتع بها مع مخططات جانت:
- تحديد التبعيات والتداخلات في المهام: تحدد مخططات جانت المهام التي يجب معالجتها أولاً وبأي ترتيب للحفاظ على سير مشروعك وتقليل التداخلات ووضع جدول زمني واضح للمشروع
- تصوّر تخصيص الموارد: بفضل النظرة العامة المتعمقة لمدة كل مهمة وأعباء عمل فريقك، يمكنك بسهولة اكتشاف أوجه القصور وإعادة تنظيم القوات قبل بدء المشروع
- إدارة المشاريع في جميع المراحل: تتيح لك مخططات جانت مراقبة المشاريع طويلة الأجل طوال دورة حياة المشروع. يمكنك التحكم في العناصر الاستراتيجية الشاملة لخطة المشروع الشاملة والفروق الدقيقة في الجدولة المعقدة بشكل أفضل
مخططات جانت التقليدية مقابل مخططات جانت الرشيقة في إدارة المشاريع
تدور مخططات جانت التقليدية حول جداول زمنية ثابتة ولا تسمح بمجال كبير للتغييرات. يعمل هذا عادةً مع منهجيات الشلال حيث يكون لديك خطة توضح بالتفصيل كل شيء من بداية المشروع إلى نهايته، محددة ليتم إكمالها خطيًا. تلتزم هذه المخططات بجداول زمنية صارمة ولا تشتهر بمرونتها. بالإضافة إلى ذلك، فإنها غالبًا ما تفشل في تلبية توقعات أصحاب المصلحة من حيث تتبع التقدم الواقعي.
ومع ذلك، مع تبني المزيد من الفرق لإطار العمل الرشيق لمشاريعهم، فمن الطبيعي أن تتكيف مخططات جانت. تجمع مخططات جانت لفرق العمل الرشيقة بين أفضل ما في العالمين، حيث تقدم عادةً مهام وتبعيات خاصة بالمشروعات. وبهذه الطريقة، تحصل الفرق على مساحة كافية للمناورة لتبديل المسارات بعد كل سباق.
تعرض معظم أدوات مخططات جانت الحديثة المعلومات المتعلقة بالمشاريع بشكل خطي - الأمر متروك لك لتخصيصها للمؤسسات التقليدية أو الرشيقة.
مخططات جانت مقابل الجداول الزمنية للمشروع مقابل لوحات كانبان
مخططات جانت ليست مماثلة تمامًا للجداول الزمنية أو لوحات كانبان ، على الرغم من أن جميع هذه الأدوات تشترك في الغرض من تصور مهام المشروع. الجداول الزمنية للمشروع تعطيك لمحات عامة سريعة عن جميع المهام بترتيب زمني - فهي تركز أكثر على التسلسل الزمني وتتجاهل التبعيات ومدد المهام (التي تقدمها مخططات جانت).
من ناحية أخرى، تصنف لوحات كانبان مهامك وفقًا لحالتها، مثل القيام أو الانتظار. إليك ما تبدو عليه لوحة كانبان النموذجية:

يمكنك الإشراف على المهام والمشروعات في لمحة واحدة وسحب المهام وإفلاتها وفرزها وتصفيتها دون عناء باستخدام طريقة عرض لوحة كانبان القابلة للتخصيص بالكامل
أمثلة على مخطط جانت البياني
إن أفضل طريقة لفهم ماهية مخططات جانت هي ملاحظة الأمثلة . سنستخدم نماذج من انقر فوق وهو موقع شهير برنامج مخطط جانت البياني لتوضيح كيف يمكن لمخططات جانت أن تخدم حالات استخدام مختلفة.
مخطط جانت لمشروع إنشائي

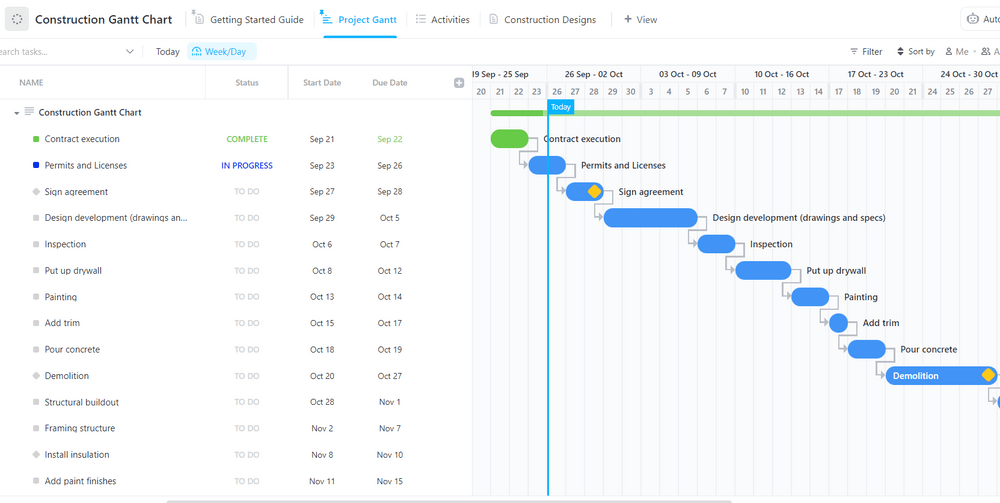
تأكد من أن الجميع على نفس الصفحة باستخدام مخطط جانت الإنشاءات البسيط هذا لتتبع المعالم الرئيسية وتسليم المشاريع في الوقت المحدد
يركز مخطط جانت هذا على مشروع إنشائي. يتم سرد جميع المهام المتعلقة بالمشروع وحالاتها على الجانب الأيسر من الرسم البياني.
في هذا المثال، يتم عرض المهام حسب التسلسل الزمني ويتم تنظيمها بحيث لا يوجد تداخلات. المهام المميزة بعلامة الماس الأصفر هي معالم المشروع - فهي تمثل نقاط تقدم مهمة في الجدول الزمني للمشروع. يحتوي مخطط جانت هذا على محطتين رئيسيتين -اتفاقيةالتوقيعوالتفكيك_، للدلالة على الأحداث الرئيسية.
مخطط جانت لإدارة الحسابات

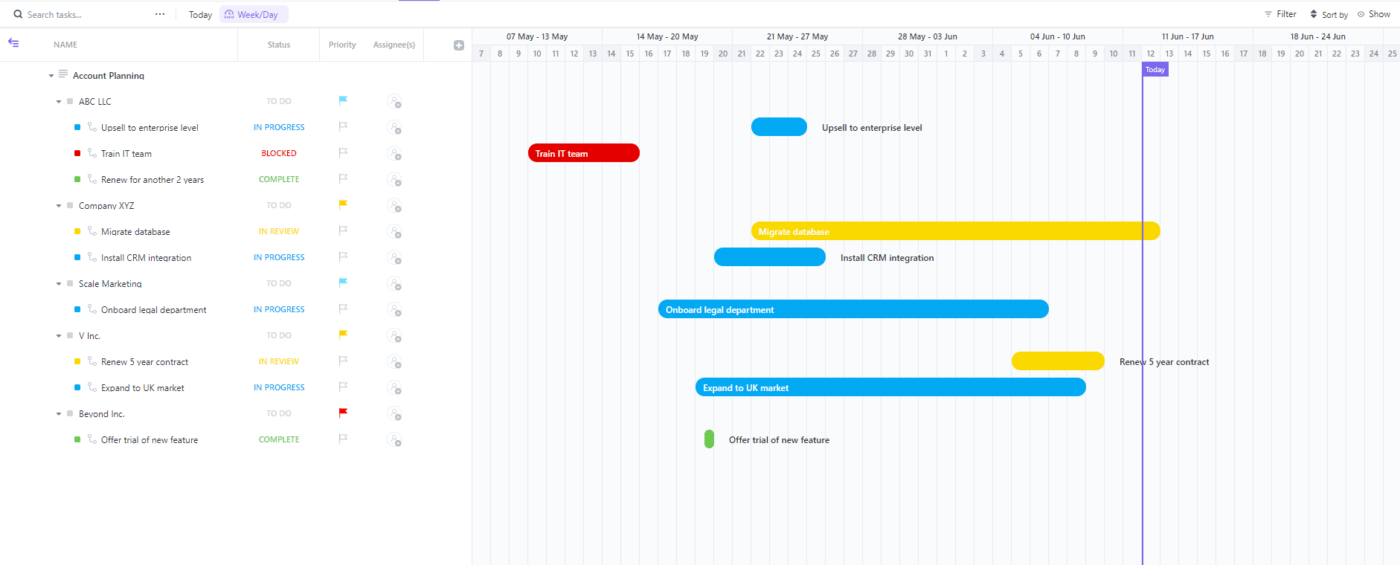
استخدم قالب تخطيط حساب ClickUp Gantt لإدارة حساباتك والمهام المتعلقة بها دون عناء
يركز مخطط جانت هذا على إدارة الحسابات مع عملاء متعددين. تحت كل عميل مدرج على الجانب الأيسر من الصورة، سترى المهام المتعلقة به. يتم تصور هذه المهام في المخطط الشريطي حيث يمكنك الوصول بسهولة إلى مدتها وتحديد المعالم الرئيسية وتحديد التداخلات.
هذا المثال بالذات يصور المهام في بيئة رشيقة، لذا فهي غير منظمة زمنياً. يتيح لك ذلك إعداد جداول زمنية أكثر مرونة وإعادة تعيين مديري الحسابات لاستيعاب أي تحديثات في اللحظة الأخيرة.
ما هي خارطة الطريق؟
A خارطة الطريق هي أداة لإدارة المشروع تساعدك على إنشاء خطة مشروع استراتيجية و تحديد الأهداف الرئيسية . فهو لا يهتم بالتفاصيل الدقيقة مثل الجداول الزمنية الدقيقة والتبعيات - فخرائط الطريق تجسد التفكير الاستراتيجي والأهداف ذات الصورة الكبيرة التي توجه في نهاية المطاف التخطيط التفصيلي للمشروع وتنفيذه.
يعتمد المظهر المرئي لخرائط الطريق على ما تفضله - يمكنك تمثيلها على ألواح بيضاء كمخططات انسيابية أو في جداول بيانات.
إلى جانب تقديم نظرة عامة رفيعة المستوى للمشروع، يمكن أن تكون خرائط الطريق بمثابة أدوات اتصال واسعة النطاق. تمثل خارطة الطريق الموضوعة بشكل جيد مسار مشروعك، بحيث يمكنك استخدامها لإبقاء أصحاب المصلحة على اطلاع على العناصر المحددة لمسارك إلى الأمام، خاصة بالنسبة للمشاريع المعقدة.
يمكنك القول إن خرائط الطريق تركز على السبب (ما هو الهدف من المشروع؟)، بينما تركز مخططات جانت على ماذا (ما هو الجدول الزمني للعمل اليومي لإكمال المشروع؟).
مزايا ### مزايا خرائط طريق المشروع
تشمل المزايا العديدة لخرائط الطريق ما يلي:
- الحفاظ على مواءمة الفرق: عندما تعرف فرق المشروع السبب وراء مبادرة ما، يمكنهم التأكد من أن تحركاتهم تتماشى مع الأهداف الأوسع نطاقًا
- تخدم كأداة تخطيط قوية لكبار المدراء: تعتبر مخططات جانت أدوات تخطيط رائعة للمدراء التنفيذيين، لكن خرائط الطريق تساعد الإدارة العليا في معرفة الجوانب الأكثر إلحاحًا مثل الميزانية وتخصيص الموارد عبر المشاريع
- تعاون سلس متعدد الوظائف باستخدام الأدوات: لنفترض أنك تدير نفس المبادرة واسعة النطاق لإطلاق منتج جديد عبر الأقسام. ومع ذلك، فإن التقدم بطيء بسبب وجود فجوات في المعلومات بين الفرق، مما يؤدي إلى جداول زمنية فاشلة. ولكن باستخدام أدوات خارطة الطريق القوية، يمكنك تكوين خارطة الطريق الخاصة بك لعرض تحديثات التقدم وحواجز الطريق في الوقت الفعلي، مما سيوجه المديرين المباشرين أو رؤساء الأقسام لتحديث جداول العمل بشكل أسرع
أمثلة على خارطة الطريق
دعنا نلقي نظرة على مثالين لخرائط الطريق في ClickUp لفهمها بشكل أفضل من وجهة نظر عملية.
خارطة طريق إصدار منتج جديد

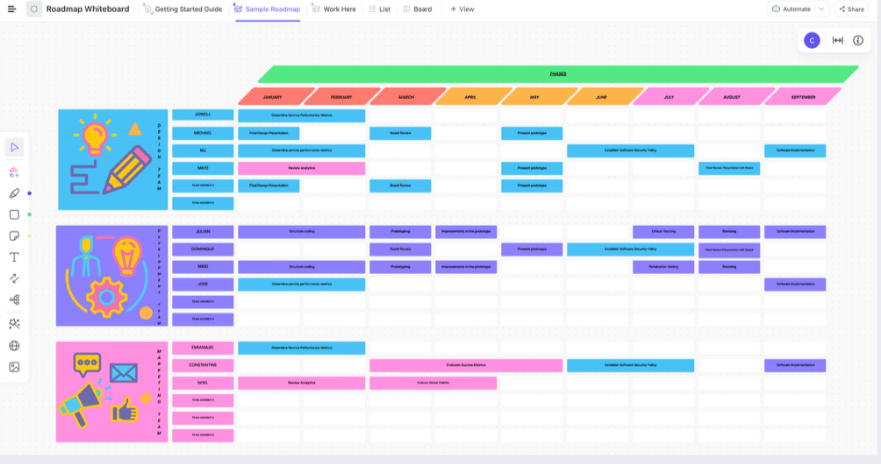
قم بتنظيم أفكارك بوضوح وابدأ في غزو السوق باستخدام قالب لوحة المعلومات الخاص بخارطة طريق ClickUp
تعكس خارطة الطريق المتطورة هذه الجدول الزمني لإصدار منتج جديد. وهي تقسم المشروع إلى فرق - التصميم والتطوير والتسويق - لتتبع التقدم المحرز بسهولة.
يتم ترميز كل نشاط على خارطة الطريق بالألوان اعتمادًا على الفريق المسؤول. يتم فرز الأنشطة أيضًا وفقًا للشهر الذي تستحق فيه - لاحظ كيف أن خريطة الطريق لا تركز على الأنشطة اليومية أو الأسبوعية كما يفعل مخطط جانت.
خارطة طريق تطوير المنتج

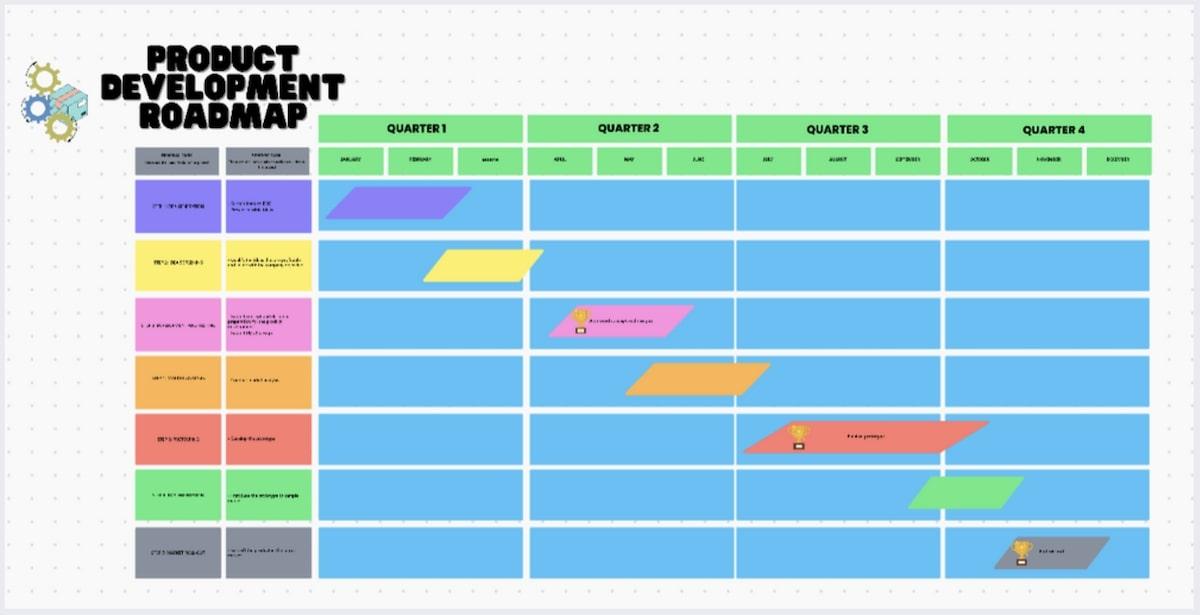
استخدم قالب خارطة طريق المنتج ClickUp لتصور عملية تطوير المنتج
إليك مثال آخر على كيفية استخدام ClickUp كأداة لخارطة طريق عبر الإنترنت لتصور عملية تطوير المنتج. في هذه الحالة، يتم تقسيم المشروع إلى ثلاث مراحل واسعة دون قيود زمنية، وهي
- أفكار المنتج وتحديد الأولويات
- تسليم المنتج وخارطة الطريق
- إطلاق المنتج
هذا المثال هو خير دليل على أن خرائط الطريق تدور حول الصورة الكبيرة لمشروع معين. فهي لا تقوم بتكبير المدة الزمنية الدقيقة لكل مهمة أو الجهة المسندة إليها - بل تسمح فقط بتطوير استراتيجية أكثر تعقيداً للمنتج.
الاختلافات الرئيسية بين مخططات جانت وخرائط الطريق
لا بد أنك فهمت الآن الفكرة الأساسية لمخططات جانت وخرائط الطريق. لكن بالنسبة للعين غير المدربة قد تبدو متشابهة. 👀
لذا، دعنا نعيد النظر في كلا المفهومين من ثلاث وجهات نظر مختلفة.
1. الوظيفة
كما تمت مناقشته في الأقسام الخاصة بكل منهما أعلاه، تختلف مخططات جانت وخرائط الطريق في وظيفتهما الأساسية. يمكنك استخدام الأولى لإنشاء خطة مفصلة لإكمال المشروع وتحديد كل مهمة وتابعية ونشاط ذي صلة عبر جدول زمني محدد مسبقًا إلى جانب المواعيد النهائية
من ناحية أخرى، تمثل خرائط الطريق، من ناحية أخرى، الجدول الزمني العام أهداف المشروع ونطاق العمل على المستوى الكلي. على سبيل المثال، يمكن أن تكون خارطة الطريق عبارة عن تصور بسيط لجميع مراحل المشروع، مثل:
- العصف الذهني
- تحديد أولويات الميزات
- تطوير المفهوم
- تخطيط التسويق
- تطوير المنتج
- الاختبار
- إطلاق المنتج
هذا مسار تقريبي لخطة مشروعك المستقبلي. والآن، عندما تقوم بتقسيم كل مرحلة إلى جدول زمني مفصل للتأكيد على العمل الخطي - فأنت تقوم بعمل مخطط جانت.
2. الجمهور
يقودنا هذا المستوى من التفاصيل إلى اختلاف مهم آخر - الجمهور. الفئة المستهدفة لمخططات جانت الخاصة بك هي فريقك - فهم يستخدمونها كبوصلة ترشدهم في الاتجاه الصحيح فيما يتعلق بما يجب القيام به وبأي ترتيب. أما أكبر مستخدمي خرائط الطريق الخاصة بك فيشملون أصحاب المصلحة ذوي المستوى الأعلى، مثل كبار المديرين والمستثمرين والشركاء والمديرين التنفيذيين الذين يستثمرون في ربحية المشروع.
3. الإطار الزمني
الفرق الآخر بين أداتي إدارة المشروع هو الإطار الزمني. نظرًا لأن مخططات جانت أكثر تفصيلاً، فإنها تركز عادةً على فترات أقصر بتواريخ محددة. من ناحية أخرى، تتمتع خرائط الطريق بجدول زمني أكثر استرخاءً، ولا تتضمن تواريخ ملتزم بها، ويمكن أن تمتد على مدار سنوات.
خارطة الطريق مقابل مخطط جانت: ماذا يجب أن تختار؟
لا تهتم خرائط الطريق بالتفاصيل، لذا يجب أن تكون هي اختيارك عندما تريد:
- الحصول على نظرة عامة عالية المستوى لمشروعك
- عرض أهداف المشروع على أصحاب المصلحة
- إبقاء فرق مشروعك على نفس الصفحة فيما يتعلق بالأهداف طويلة الأجل
من ناحية أخرى، تُعد أداة مخطط جانت أكثر ملاءمة عندما تحتاج إلى
- التعمق في تفاصيل المشروع
- تحديد المهام/الجداول الزمنية لإنشاء المساءلة
- التخطيط للأولويات والتبعيات
تذكر أن كلتا الأداتين ليستا متعارضتين. بل على العكس تمامًا - استخدام كلتيهما يؤدي إلى إدارة المشروع بشكل جيد. نقطة البداية هي إنشاء خارطة طريق تحدد فيها الأهداف والاستراتيجيات. بعد ذلك، ستحصل على موافقة أصحاب المصلحة عليها ومشاركتها مع مديري المهام، الذين سيعتمدون في النهاية على معلوماتها لإعداد مخططات جانت.
مخطط جانت مقابل خارطة الطريق: أيهما يناسب "أجايل" بشكل أفضل؟
يتمحور سير العمل الرشيق حول المرونة والقدرة على التكيف والتعاون. فهي تستوعب التغييرات المتكررة أثناء التنقل دون التسبب في انهيار مشروعك مثل بيت من ورق.
لقد أثبتنا أن مخططات جانت التقليدية ليست ملائمة للأجايل لأنها تركز على الجداول الزمنية والتفاصيل الدقيقة. فهي ليست مصممة لدعم التغييرات المتكررة، وهو ما يتعارض مع أساس إطار العمل الرشيق. ومع ذلك، لا يزال مديرو المشاريع الرشيقة يحبون المزايا المؤيدة للتتبع لهذه المخططات المرئية. لهذا السبب يتم عادةً تعديل مخططات جانت الحديثة لتمثيل مهام العدو السريع - بدلاً من سير عمل المشروع بأكمله.
تُعد خرائط الطريق أكثر ملاءمة للرشاقة لأنها ليست مفصلة. فهي تركّز على النتائج المرجوة بدلاً من المخرجات، مما يمنح فريقك المزيد من الفسحة في تعديل الجداول الزمنية. ومع ذلك، فإن خرائط الطريق ليست مثالية دائمًا لأنها لا تزال تحد من عملك. فهي تتعلق بالتخطيط طويل الأجل وقد تحتاج إلى تغييرها بشكل متكرر لدعم التطوير التكراري للبرمجيات، وهو أمر غير منتج.
ومع ذلك، يمكن أن يكون كل من مخططات جانت وخرائط الطريق جزءًا قيمًا من سير العمل الرشيق إذا كنت تستخدم منصة إدارة المشاريع -مثل ClickUp. يعمل هذا البرنامج كخارطة طريق وبرنامج مخطط جانت، مما يساعد فرق العمل الرشيقة على البقاء على رأس الاستراتيجيات طويلة الأجل بالإضافة إلى سير العمل اليومي.
إنشاء مخططات جانت وخرائط طريق مثالية باستخدام ClickUp
لا يوجد تنافس بين مخططات جانت وخرائط الطريق - فكلاهما يمكن أن يدعم ويبسط عمليات إدارة مشروعك. ولكن، لا يمكنك زيادة فوائدهما إلى أقصى حد إلا إذا كنت تستخدم برنامجًا من الدرجة الأولى إدارة المهام والمشاريع أداة.
ClickUprises للمناسبة ويتيح لك الجمع بين قوة مخططات جانت وخرائط الطريق للتحكم الكامل في عملك. 🤓
دعنا نرى كيف يساعدك ClickUp أنت على إنشاء وإدارة مخططات جانت وخرائط الطريق.
قم بإنشاء جداول زمنية مفصلة ومرنة باستخدام مخططات جانت من ClickUp

استخدم مخططات جانت في ClickUp لتتبع الإنتاجية بالإضافة إلى التأخيرات والاختناقات
تتمثل إحدى ميزات ClickUp الرئيسية في قدرته على إظهار مشاريعك من وجهات نظر مختلفة، وكل ذلك ممكن بفضل مشاهدات ClickUp . لديك الكلاسيكيات مثل لوحة كانبان و عرض القائمة التي تساعدك على تنظيم المهام وتصنيفها، بالإضافة إلى طرق العرض المتقدمة لتكبير التفاصيل.
أحد الخيارات المتقدمة هو عرض مخطط جانت البياني . باستخدامه، يمكنك تصور وإدارة جميع المهام والتبعيات المتعلقة بالمشروع، وتحديد الأولويات، والتعاون مع فريقك.
مخططات جانت في ClickUp ديناميكية وسهلة التصفية - بمجرد إنشاء المهام و معالم المشروع مع التفاصيل المصاحبة، يمكنك تخصيص ما تراه على المخطط. على سبيل المثال، قد ترغب في رؤية ما هو مسؤول عنه عضو معين في الفريق، لذا ستضغط على الزر فرز حسب في أعلى المخطط وتختار الاسم. لديك معايير فرز أخرى، مثل تاريخ الاستحقاق أو الأولوية أو الحالة.
إن التحقق من تقدم مهمة معينة أمر سهل مثل تمرير الماوس فوقها - سيعرض لك النقر فوقها النسبة المئوية الدقيقة.
يُعد تصميم السحب والإفلات ميزة أخرى لمخططات ClickUp Gantt البيانية. فبفضله، يمكنك تعديل مهامك بسرعة، وأنت تعرف ما يعنيه ذلك - يمكن أن تتناسب المخططات مع سير عملك الرشيق مثل القفازات! 🧤
إلى جانب السماح لك بإجراء تغييرات سريعة، فإن واجهة السحب والإفلات مثالية لإنشاء تبعيات المهام . كل ما عليك القيام به هو ربط المهام، وسيقوم ClickUp تلقائيًا بتعيين حظر أو انتظار التبعيات. إذا قمت بتمكين المسار الحرج (من خلال تحديد تخصيص ثم المسار الحرج في الزاوية العلوية اليمنى من الرسم البياني)، ستسمح ل ClickUp بتتبع الاختناقات المحتملة وغيرها من الجداول الزمنية المحتملة للتسليم.
الاستفادة من لوحات ClickUp البيضاء لخرائط الطريق

استخدم قالب السبورة البيضاء لخريطة طريق تطوير المنتج من ClickUp لتخطيط وتتبع والاحتفال بصريًا بمعالم تطوير منتجك
يحتوي ClickUp على ميزة رائعة للتعاون في الوقت الفعلي ورسم خرائط الطريق تسمى ClickUp Whiteboards . تتيح لك هذه اللوحات الرقمية لك ولفريقك تبادل الأفكار ووضع الاستراتيجيات وتحويل أفكارك إلى مفاهيم بنقرات قليلة.
بمجرد تشغيل Whiteboards، فإن شريط الأدوات الصغير الموجود على اليسار هو كل ما تحتاجه لإطلاق العنان لإبداعك - ارسم واربط، اكتب نصاً، اكتب نصاً، أنشئ أشكالاً، أرفق روابط وملفات وسائط، أو أنشئ ملاحظات.
باستخدام ClickUp Whiteboards، يمكنك تصميم خرائط طريق لأي مشروع أنت مسؤول عنه، سواء كان إنشاء أو تطوير البرمجيات . استخدم واجهة السحب والإفلات لإضافة الأشكال وإنشاء وصلات لتمثيل مسار مشروعك عبر مخططات انسيابية أو خرائط مرحلية أو أي تنسيق آخر تفضله.
نظرًا لأن لوحات ClickUp Whiteboards تعرض كل تغيير في الوقت الفعلي، يمكنك دعوة أعضاء فريقك للمشاركة في بناء خارطة طريق مثالية للمشروع معًا. وبالمثل، يمكنك مشاركتها مع أصحاب المصلحة المعنيين لعرض التقدم المحرز وطلب التعليقات والتعديل وفقًا لذلك.
إذا كان إنشاء خارطة طريق من الصفر يبدو مستهلكاً للوقت، فإن ClickUp لديه الحل - القوالب! لديهم بنية تحتية معدة مسبقًا لإعداد كل من خرائط الطريق ومخططات جانت.
توصيتنا هي قالب خارطة طريق منتج ClickUp . إنه مثالي لتصور دورة حياة التطوير بأكملها، وتحديد الأولويات، وتتبع التقدم المحرز. إلى جانب عرض السبورة لخارطة الطريق الخاصة بك، يمكنك أيضًا الحصول على عرض مخطط جانت، مما يجعل القالب مثاليًا لأولئك الذين يرغبون في استخدام كلتا الأداتين للتنقل في العمليات. 🔥
قوالب أخرى لمخطط جانت وخارطة الطريق
مع مكتبة قوالب 1,000+ خيار ، ClickUp يدعمك إذا كنت تريد اختصارًا لإنشاء مخططات جانت أو خرائط الطريق.
إن نموذجي مخططات جانت اللذين نوصي باستخدامهما هما:
- انقر فوق قالب مخطط جانت البياني البسيط: مثالي لتصور المشاريع الصغيرة
- قالب الجدول الزمني ل ClickUp Gantt Timeline: يقدم ثلاث طرق عرض لمخطط جانت - أسبوعيًا وشهريًا وسنويًا، مما يسمح لك بتكبير التفاصيل والحصول على نظرة شاملة لجميع مشاريعك للسنة
استخدم قالب مخطط جانتت البياني البسيط ClickUp لتصور كل تفاصيل مشاريعك
إذا كنت ترغب في إنشاء خرائط طريق، فننصحك باستخدام هذه القوالب:
- قالب خريطة طريق ClickUp خارطة الطريق: قالب سبورة بيضاء قابل للتعديل يأتي مع أقسام معدة مسبقًا لتصنيف أنشطة الفريق وتحديد الأطر الزمنية
- قالب خريطة طريق مشروع ClickUp: يمنحك خمس طرق عرض لسرد المهام وتنظيمها ومراقبتها وتحديد المواعيد النهائية وإدارة عبء العمل في فريقك
مخطط جانت مقابل خارطة الطريق: لماذا ليس كلاهما؟
تركز مخططات جانت على التفاصيل بينما تركز خرائط الطريق على الصورة الكبيرة - وبشكل عام، يعتمد الاختيار على ما تريد مراقبته.
مع ClickUp، يمكنك إنشاء وتنظيم و إدارة كليهما دون عناء. تساعدك ميزات النظام الأساسي سهلة الاستخدام على إنشاء تصورات ديناميكية للمشروع والتحكم الكامل في سير العمل. اشترك مجانًا اليوم واستكشف الميزات المفيدة الأخرى التي تبسط إدارة المشروع! 🥰

