Organize and set priorities.
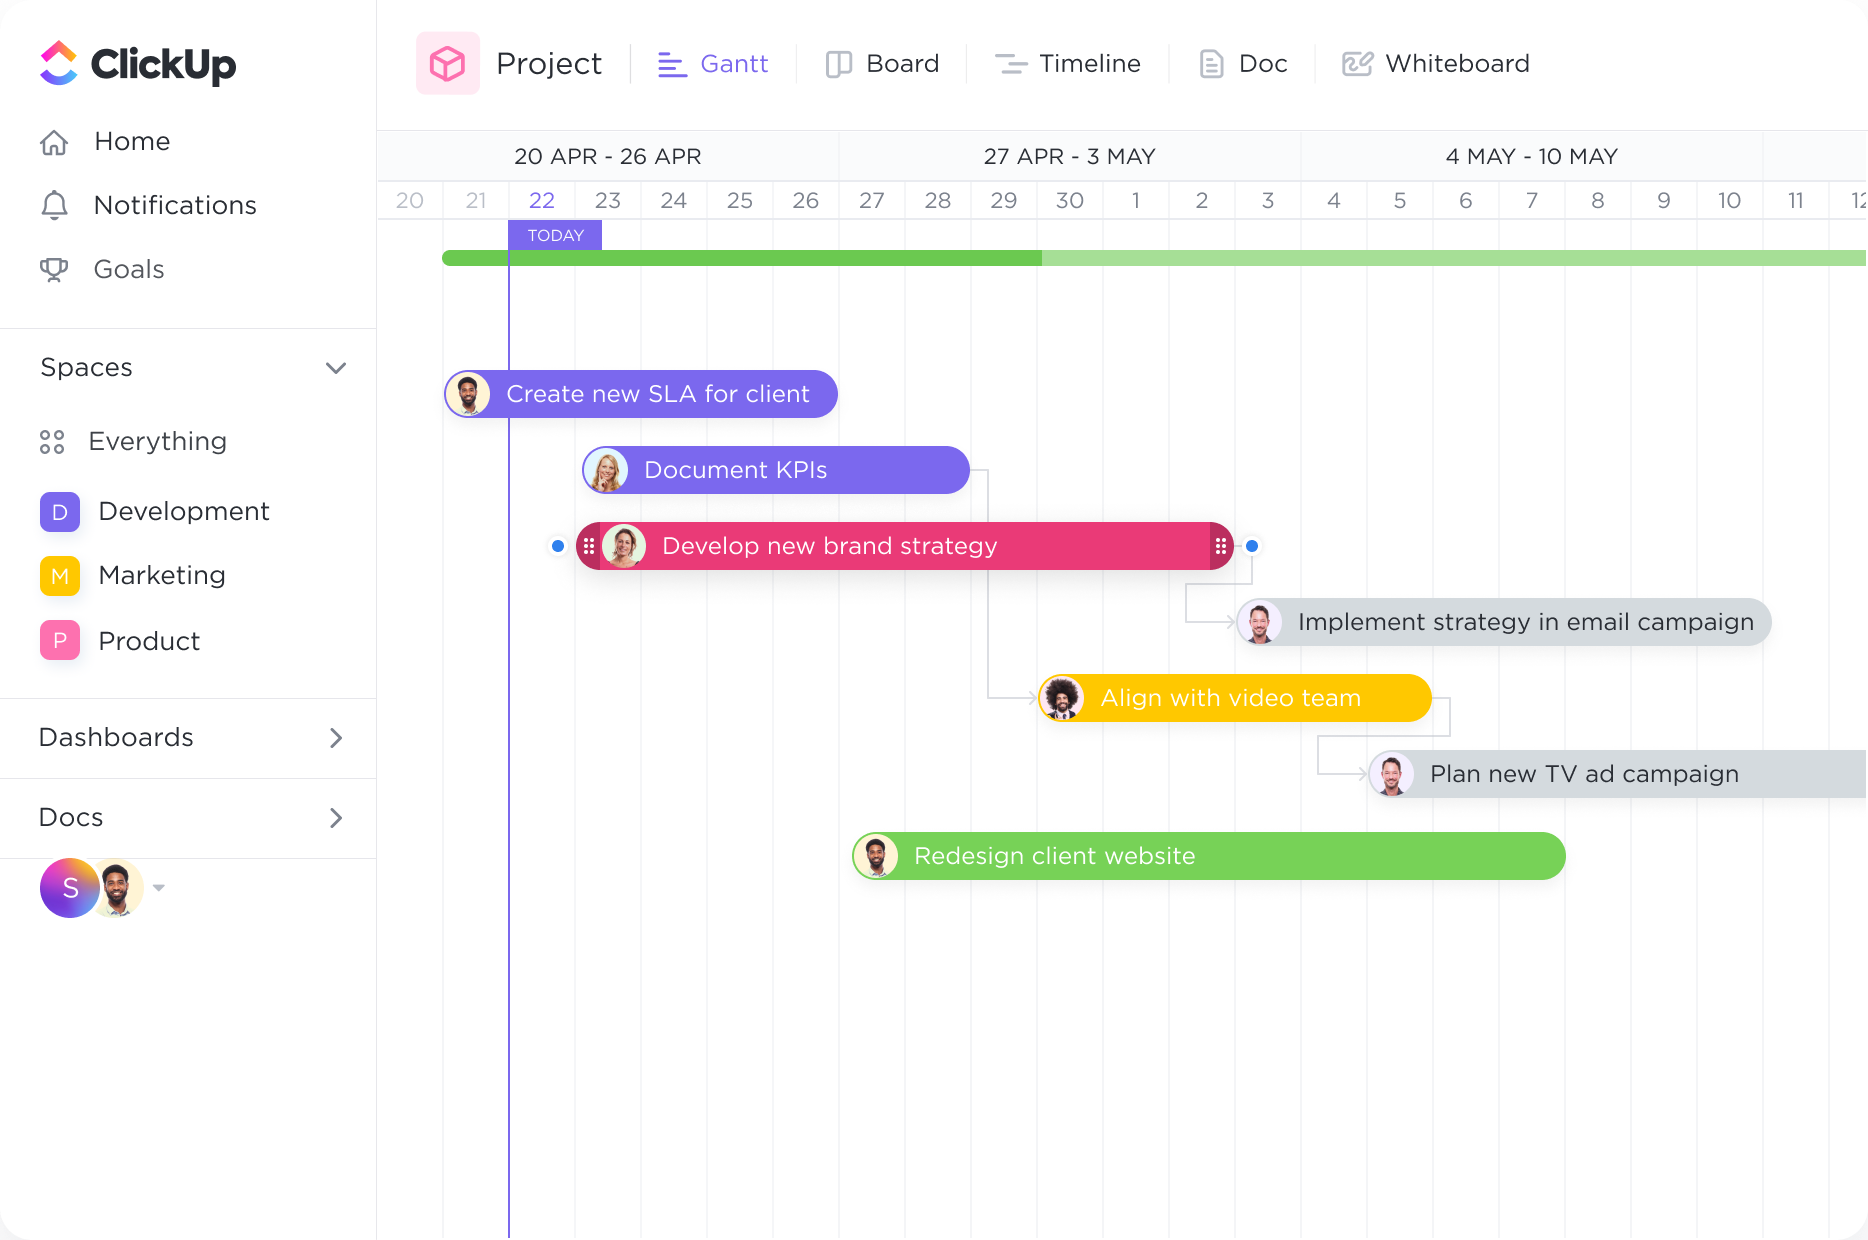
Organize how you see your tasks with quick sorting. Create cascading views with a single click to easily see what important tasks are coming next.
Transform your energy provider business with ClickUp's powerful Gantt Chart software. Streamline your project management processes and stay ahead of deadlines with ease. Plan, schedule, and track your projects effortlessly, ensuring efficient resource allocation and optimized project timelines. ClickUp empowers energy providers to visualize and manage their projects seamlessly, making Gantt Charts a breeze. Boost productivity, collaboration, and success with ClickUp's tailored Gantt Chart software today.
Free forever.
No credit card.

Trusted by the world’s leading businesses
Organize how you see your tasks with quick sorting. Create cascading views with a single click to easily see what important tasks are coming next.
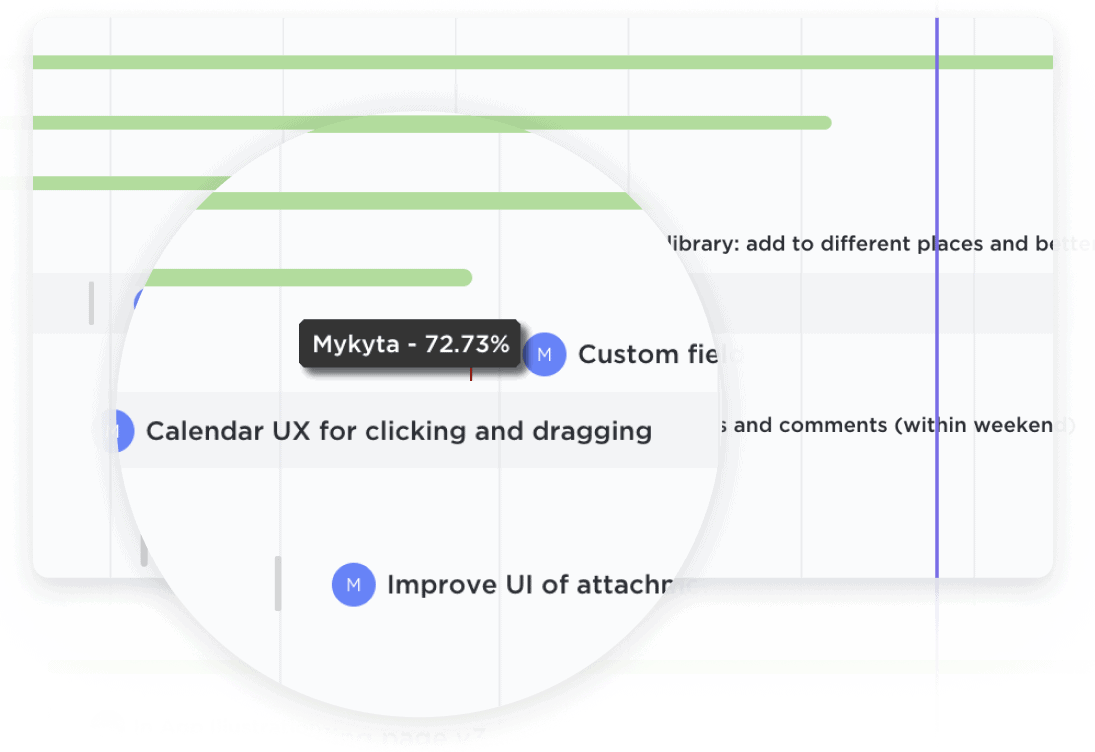
Easily update projects with a simple drag-and-drop action to collaborate amongst your team in real-time. Dynamic progress percentages provide a detailed snapshot.

Gantt charts are invaluable tools for energy providers engaged in infrastructure development projects. They allow for the visualization of project timelines, deadlines, and milestones, enabling effective project management. Energy providers can use Gantt charts to plan and track the construction of power plants, transmission lines, and other infrastructure components, ensuring that projects stay on schedule and within budget.
Energy providers need to efficiently allocate and optimize their resources, including personnel, equipment, and materials. Gantt charts provide a comprehensive overview of resource availability and utilization, allowing energy providers to allocate resources effectively across different projects and tasks. By visualizing resource allocation, energy providers can identify bottlenecks, optimize resource usage, and ensure that projects are adequately staffed and resourced.
Regular maintenance and inspection are crucial for the smooth operation of energy infrastructure. Gantt charts can be used to schedule and plan maintenance activities, including routine inspections, equipment servicing, and repairs. By incorporating maintenance schedules into Gantt charts, energy providers can proactively manage maintenance tasks, minimize downtime, and ensure the reliability and safety of their energy assets.
As the demand for renewable energy increases, energy providers are increasingly involved in planning and executing renewable energy projects. Gantt charts can be used to manage and monitor all stages of renewable energy projects, from site assessment and permitting to construction and commissioning. By visualizing the project timeline and dependencies, energy providers can ensure the timely completion of renewable energy projects and meet renewable energy targets.
To meet growing energy demands, energy providers often need to expand and upgrade their grid infrastructure. Gantt charts can help energy providers plan and track grid expansion and upgrade projects, including the installation of new substations, transmission lines, and distribution infrastructure. By visualizing the project timeline and interdependencies, energy providers can ensure that grid expansion projects are executed efficiently and with minimal disruption to the existing grid.
Energy providers operate in a highly regulated industry and need to comply with various regulatory requirements. Gantt charts can be used to plan and track regulatory compliance activities, such as environmental assessments, permitting processes, and reporting deadlines. By incorporating regulatory tasks into Gantt charts, energy providers can ensure timely compliance, avoid penalties, and maintain a strong regulatory standing.
Gantt chart software can help energy providers by visualizing project timelines, enabling better resource allocation and coordination. It allows for the identification of potential bottlenecks and delays, ensuring efficient project management. Additionally, it facilitates communication and collaboration among team members, leading to improved decision-making and overall project efficiency.
Gantt chart software can help energy providers streamline project management processes by visually mapping out project timelines, tasks, and dependencies. It allows for efficient resource allocation and scheduling, enabling teams to track progress and identify potential bottlenecks or delays. Additionally, it enhances communication and collaboration among team members, ensuring seamless coordination and more effective decision-making throughout the project lifecycle.
Yes, some Gantt chart software offers features and integrations that cater specifically to the needs of energy providers. These may include resource management tools for tracking and optimizing the allocation of energy assets, integration with energy monitoring systems for real-time data updates, and the ability to visualize and manage complex energy infrastructure projects with dependencies and critical paths.