Stay ahead of every deadline.
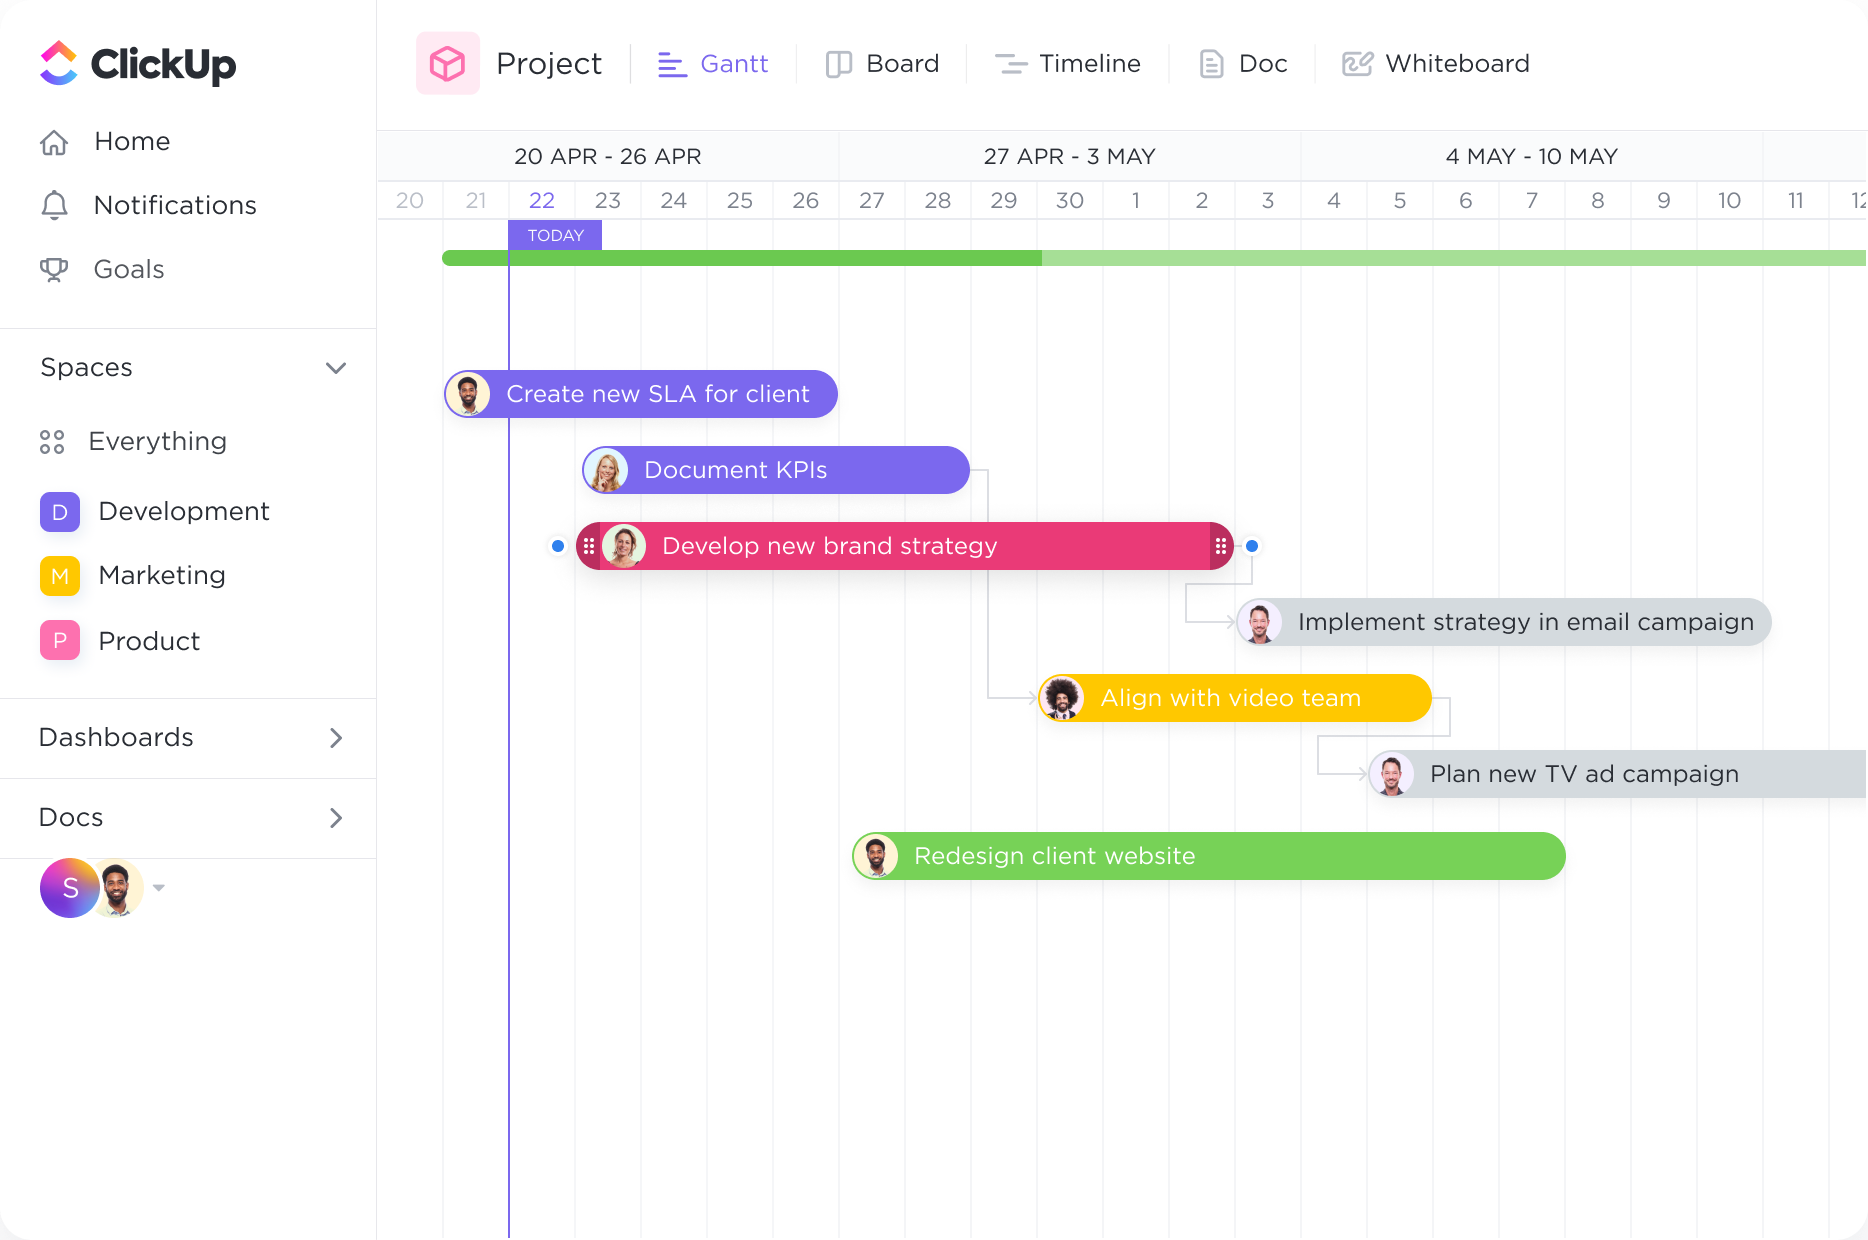
With the Gantt chart's dynamic timeline, you can easily schedule tasks, keep up with project progress, manage deadlines, and handle bottlenecks.
Supercharge your project management as an electrician with ClickUp's powerful Gantt Chart software. Streamline your workflow, boost productivity, and stay on top of deadlines with ease. Plan, track, and visualize your projects like never before with ClickUp's intuitive interface and customizable Gantt Charts. Take control of your projects and ensure success every step of the way with ClickUp.
Free forever.
No credit card.

Trusted by the world’s leading businesses
With the Gantt chart's dynamic timeline, you can easily schedule tasks, keep up with project progress, manage deadlines, and handle bottlenecks.
Organize how you see your tasks with quick sorting. Create cascading views with a single click to easily see what important tasks are coming next.
As an electrician, managing multiple projects simultaneously can be challenging. Gantt charts provide a visual representation of project timelines, deadlines, and milestones. By using Gantt charts, electricians can easily track the progress of each project, allocate resources efficiently, and ensure that all tasks are completed within the specified timeframes.
Electricians often work in teams, and effective collaboration is crucial for successful project completion. Gantt charts help allocate tasks among team members and track their progress collectively. By assigning specific tasks and responsibilities, electricians can ensure that everyone is on the same page, avoid duplication of efforts, and promote seamless collaboration.
Managing resources and equipment is essential in the field of electrical work. Gantt charts can assist electricians in optimizing the use of resources such as personnel, tools, and equipment. By visually representing the availability and allocation of resources, electricians can prevent conflicts, avoid overbooking or underutilization of resources, and ensure that all necessary equipment is allocated to projects as needed.
Meeting deadlines is crucial in the electrical industry, as delays can have a significant impact on overall project timelines. Gantt charts enable electricians to schedule tasks, set deadlines, and track their progress. By visualizing project schedules, electricians can identify potential bottlenecks, allocate additional resources if necessary, and proactively manage their workload to ensure timely project completion.
In addition to project management, electricians often need to plan and execute maintenance tasks and preventive measures for electrical systems. Gantt charts can be used to outline maintenance schedules, track ongoing maintenance tasks, and plan for future preventive measures. By incorporating these tasks into a Gantt chart, electricians can ensure that all necessary maintenance activities are scheduled and executed promptly, reducing the risk of system failures and downtime.
Gantt chart software can help you effectively manage your electrical projects by providing a visual representation of the project timeline, tasks, and dependencies. It allows you to track project progress, allocate resources efficiently, and identify potential bottlenecks or scheduling conflicts. With Gantt chart software, you can easily monitor the status of each task, track deadlines, and ensure smooth coordination among team members, ultimately enhancing the overall project management process.
There is no specific Gantt chart software that is commonly used by electricians. Electricians can use any Gantt chart software that meets their needs and preferences, such as Microsoft Project, Smartsheet, or Trello. The choice of software will depend on factors such as budget, ease of use, and specific features required for managing electrical projects.
Some key features to look for in Gantt chart software for electricians include the ability to schedule and track electrical tasks, allocate resources efficiently, manage dependencies, visualize project timelines, and collaborate with team members.