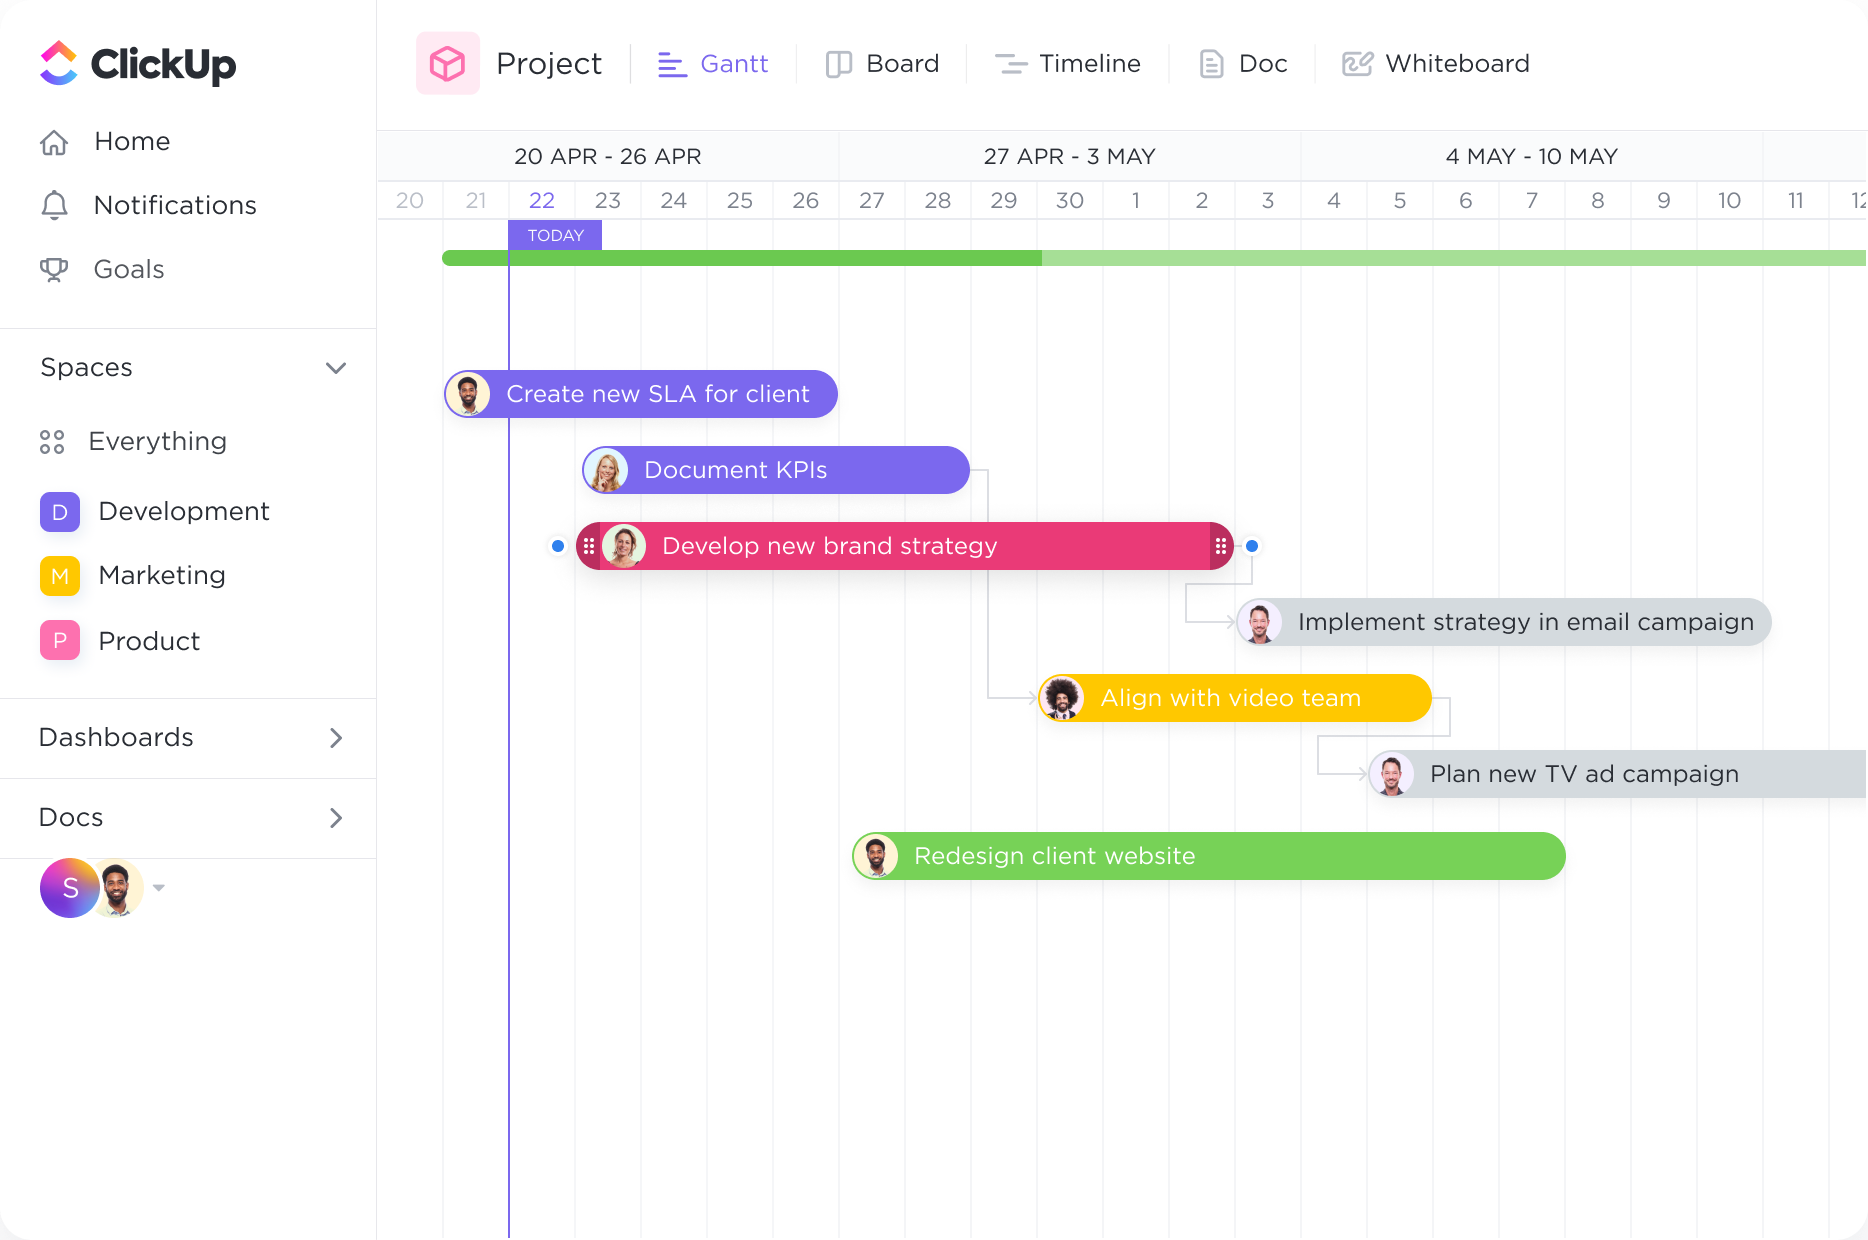
Set task dependencies.
Create tasks and link them with dependencies. Dragging a task with dependencies will automatically reschedule tasks in the chain
Supercharge your project management with ClickUp's Gantt Chart software designed specifically for Broadcasters. Streamline your workflow, track progress, and meet tight deadlines with ease. With ClickUp, you can create dynamic Gantt Charts that visually map out your projects, helping you stay organized and on track. Say goodbye to manual scheduling and hello to efficient project management with ClickUp's powerful Gantt Chart software.
Free forever.
No credit card.

Trusted by the world’s leading businesses
Create tasks and link them with dependencies. Dragging a task with dependencies will automatically reschedule tasks in the chain
Intelligent dependency-path tracking shows you where potential bottlenecks might exist to prevent inefficiencies.
Broadcasters often have a complex schedule of programs that need to be aired at specific times. Gantt charts can be used to visually plan and schedule the broadcasting of different shows, ensuring that they are aired according to the desired timeline. This helps broadcasters optimize their programming, avoid conflicts, and maintain a consistent broadcasting schedule.
Broadcasters rely on advertising revenue to support their operations. Gantt charts can be used to plan and manage ad campaigns, including the creation, scheduling, and airing of commercials. By visualizing the timeline and tasks associated with each campaign, broadcasters can ensure that ads are delivered on time and in coordination with the programming schedule.
Broadcasters often cover live events such as sports games, concerts, or award ceremonies. Gantt charts can be used to plan and coordinate all aspects of live event coverage, including pre-production, setup, broadcasting, and post-production activities. This helps broadcasters ensure that all necessary resources and personnel are allocated appropriately, and that the event is covered seamlessly.
Gantt charts can be utilized in newsrooms to plan and manage the production and reporting of news stories. This includes tasks such as researching, interviewing, filming, editing, and airing news segments. By visualizing the timeline and dependencies of each task, broadcasters can streamline their news production process, ensure timely delivery of news content, and maintain a consistent news schedule.
Broadcasters rely on a wide range of equipment, from cameras and microphones to broadcasting software and transmission systems. Gantt charts can be used to schedule and track equipment maintenance, upgrades, and replacements. By visualizing the timeline for these activities, broadcasters can ensure that their equipment is in optimal condition and minimize downtime due to maintenance or upgrades.
Broadcasters often need to localize and translate content to reach a broader audience. Gantt charts can be used to plan and manage the localization process, including translation, dubbing, subtitling, and quality assurance. By visualizing the timeline and tasks associated with each localization project, broadcasters can ensure that content is translated and adapted in a timely manner, allowing them to expand their reach and cater to diverse audiences.
Gantt chart software can help broadcasters in managing their projects effectively by providing a visual representation of project timelines, tasks, and dependencies. It enables broadcasters to track progress, identify bottlenecks, and adjust schedules in real-time. Additionally, it facilitates collaboration among team members and improves communication by offering a clear overview of project statuses and deadlines. This enhances project coordination, efficiency, and decision-making in the broadcasting industry.
Broadcasters should look for Gantt chart software that offers customizable project timelines and dependencies, allowing for the visualization of complex broadcast schedules. It should have the ability to allocate and manage resources efficiently, track task progress, and identify potential scheduling conflicts. Additionally, robust collaboration and communication features, such as real-time updates and notifications, are essential for effective coordination among team members.
Yes, Gantt chart software can be integrated with other broadcasting tools and platforms, allowing for seamless project management processes. This integration enables teams to centralize project data, streamline communication, and automate updates across different tools, enhancing collaboration and efficiency.