بصفتك مديراً للمشروع، فإن فهم مقدار العمل الذي يمكن لفريقك التعامل معه هو أولوية قصوى.
وهذا يساعد مديري المشاريع على تصميم خططهم المستقبلية، وتحديد ما إذا كان بإمكان فريقهم تولي مشاريع جديدة، وتحديد ما إذا كانوا بحاجة إلى ضم أعضاء جدد إلى الفريق. 🚢
يعد تحديد حدود مواردك أمرًا صعبًا في أفضل الأحوال بدون تخطيط القدرات. تتيح هذه العملية رؤى قيمة حول قدرات القوى العاملة والأدوات والمؤسسة بأكملها. إن معرفة ما لديك للعمل به يضمن أن يكون فريقك دائمًا على المسار الصحيح ويمكنه إكمال المشاريع المعلقة في المواعيد النهائية.
على الرغم من أن الأمر قد يبدو معقدًا، إلا أن تصور تخطيط السعة يمكن أن يكون سهلًا إذا كان لديك الأدوات المناسبة للمهمة و إكسل واحد منهم .
في هذه المقالة، سنعلمك كيفية إظهار تخطيط السعة في Excel وسنقدم لك بعض نماذج تخطيط السعة التي تمد يد المساعدة.
ما هو تخطيط السعة؟ تخطيط السعة هي عملية تحديد الموارد المطلوبة لتنفيذ مشروع ما بنجاح. عندما نقول الموارد، فإننا نعني القوى العاملة والوقت المتاح والمعدات والأدوات والميزانية اللازمة.

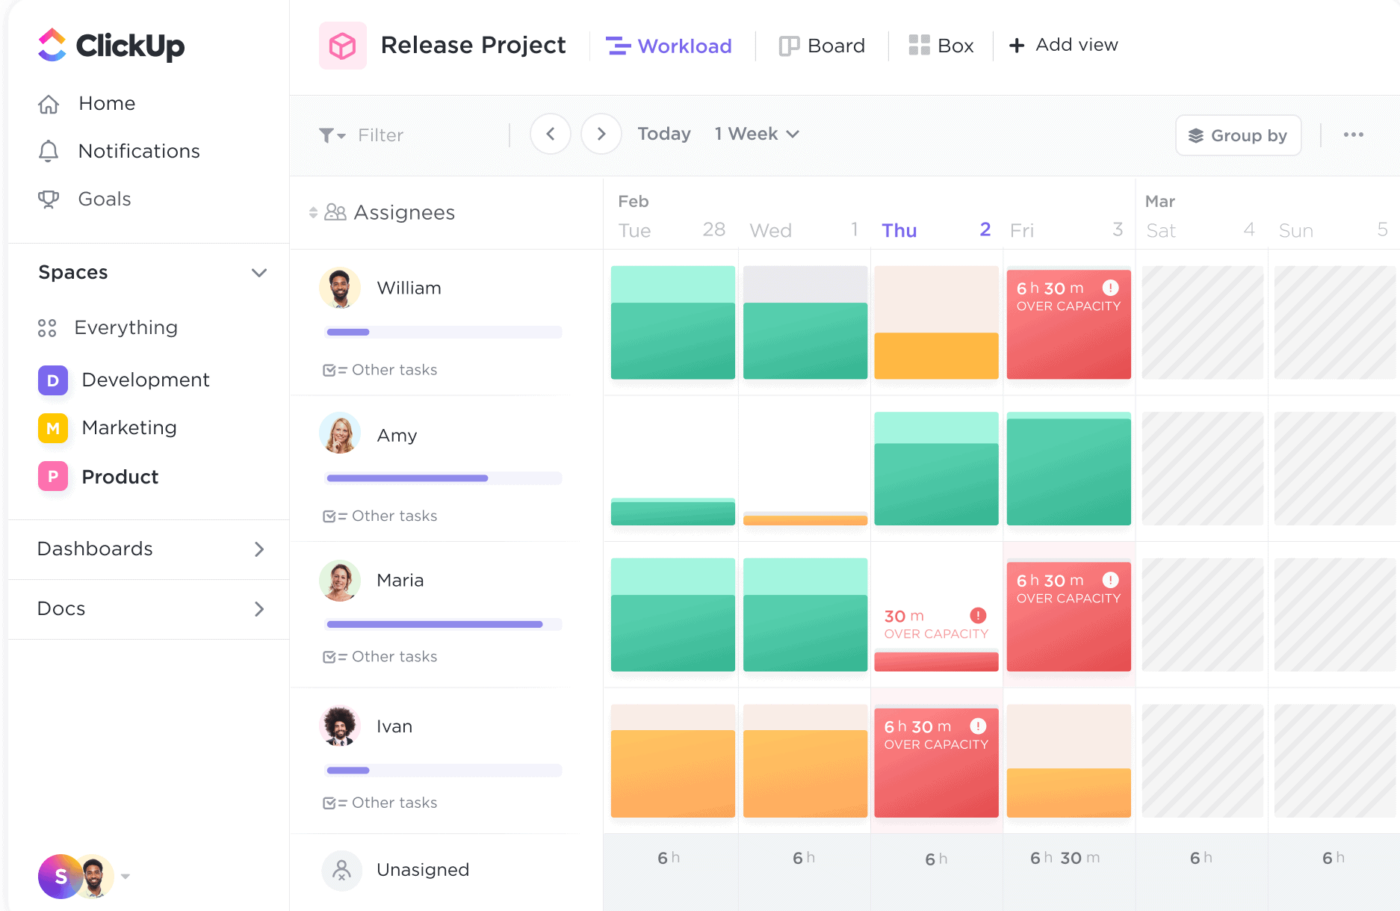
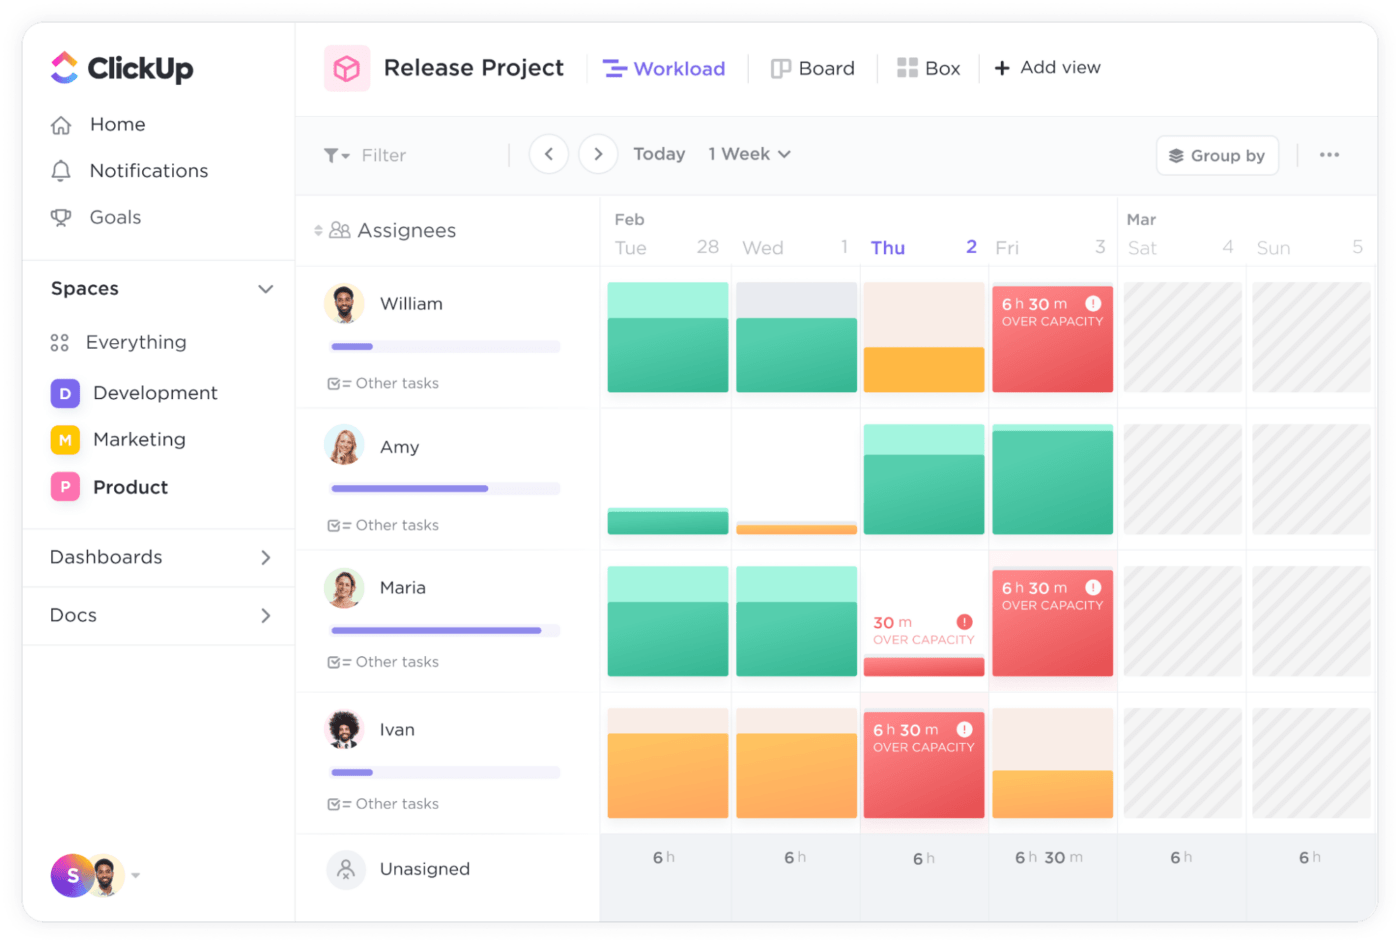
افهم في لمحة سريعة من في فريقك الذي يعاني من نقص أو إفراط في العمل حتى تتمكن من إعادة تخصيص مواردك بسهولة
إنها عملية مهمة في العديد من الصناعات، من التكنولوجيا إلى الطب. انظر إلى الضيافة - المطاعم دائماً ما يكون لدى المطاعم المزيد من الأشخاص الذين يعملون خلال الصيف والعطلات.
فهم يعلمون أن المزيد من الزبائن يأتون خلال فترات محددة، لذا فهم بحاجة إلى تجهيز أنفسهم من حيث الموظفين والإمدادات اللازمة للحفاظ على سير العمل في المكان بسلاسة. 🥘
هذا بالضبط ما يفعله مديرو المشاريع - فهم ينظرون إلى الماضي لفهم الحاضر والاستعداد للمستقبل.
كيفية إظهار تخطيط سعة الموارد في جداول بيانات Excel
لا يوفر برنامج Excel ميزات متقدمة لتخطيط سعة الموارد، ولكن خياراته غالبًا ما تكون أكثر من كافية لفهم النطاق الترددي الحالي لفريقك والتخطيط وفقًا لذلك.
سنوضح لك هنا كيفية استخدام برنامج Excel لتحديد ما إذا كان فريقك يحتاج إلى المزيد من الأشخاص للعمل بكفاءة وإكمال جميع المشاريع. لقد استخدمنا أبسط مثال لوصف ما يجب عليك فعله لتصبح خبيرًا في تخطيط القدرات في Excel. 👑
بمجرد أن تفهم الأساسيات، يمكنك توسيع نطاقك والتخطيط لمشاريع و/أو وظائف و/أو مهارات متعددة.
الخطوة 1: إنشاء جدول تقدير الطلبات

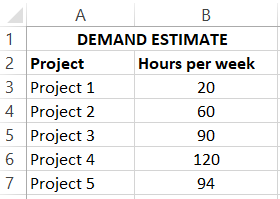
ضع قائمة بمشاريعك والوقت الذي يجب أن تستغرقه لإكمال كل منها في جدول تقدير الطلب
الخطوة الأولى هي إنشاء جدول لتوضيح عدد الساعات التي يحتاجها فريقك في الأسبوع لإنجاز كل مشروع.
افتح برنامج Excel و اكتب "تقدير الطلب" في الخلية A1 - سيكون هذا هو اسم الجدول. بعد ذلك، اكتب "المشروع" في الخلية A2 و"الساعات في الأسبوع" في الخلية B2. أدرج مشاريعك تحت عمود "المشروع".
تحت "الساعات في الأسبوع"، اكتب عدد الساعات المطلوبة في مشروع معين.
- نصيحة 1: قم بتمديد عرض الأعمدة لاستيعاب كل اسم دون أن يبدو الجدول فوضويًا. يمكنك أيضًا كتابة أسماء الأعمدة بخط عريض لتسهيل متابعة الجدول.
- النصيحة 2: إذا كنت تحاول إدخال عدد الساعات ولكن Excel يستمر في تحويله إلى تاريخ، فتأكد من صحة التنسيق. في معظم الحالات، يجب أن تضبطه على "عدد" اعتمادًا على بياناتك، يمكنك أيضًا إظهار الأرقام بدون علامات عشرية.
الخطوة 2: إنشاء جدول نظرة عامة على السعة

استخدم جدول نظرة عامة على السعة لعرض عدد الموظفين، وعدد ساعات عملهم في الأسبوع، ومعدل استخدامهم
قم بإنشاء جدول آخر لعرض عدد الموظفين لديك وعدد ساعات عملهم في الأسبوع.
اكتب "نظرة عامة على السعة" في الخلية D1. اكتب "عدد الموظفين" في الخلية D2، و "ساعات العمل في الأسبوع" في الخلية E2، و "معدل الاستخدام" في الخلية F2.
يمثل معدل الاستخدام النسبة المئوية للساعات التي يقضيها موظفوك في العمل المدفوع. على سبيل المثال، قد يكون لدى موظفيك يوم عمل مدته ثماني ساعات، ولكن هذا لا يعني بالتأكيد أنهم سيكونون منتجين بنسبة 100% من الوقت. يجب أن يأخذوا استراحات الغداء أو المرحاض أو القيام بمهام غير متعلقة بالعمل. يأخذ موظفوك أيضًا الإجازات والإجازات المخطط لها، والتي يتم احتسابها أيضًا في معدل الاستخدام الكلي.
حتى عندما يعمل موظفوك بكامل طاقتهم، لا يتم احتساب كل ما يقومون به كعمل مدفوع الأجر. أحد الأمثلة على ذلك المهام الإدارية التي يجب القيام بها، ولكن قد لا تكون ذات صلة بمشاريعك الجارية.
في مثالنا، لدينا 10 موظفين يعملون 40 ساعة أسبوعيًا في المتوسط بمعدل استخدام 80%.
الخطوة 3: قم بإنشاء جدول تخطيط القدرات

تمثيل إجمالي الطلب على المشروع، والسعة المحتملة، والسعة الفعلية معبراً عنها بالساعات
تتمحور الخطوتان الأوليان حول إدخال البيانات، وتركز هذه الخطوة على تحليل البيانات المدخلة وتحويلها إلى معلومات. هذه هي الخطوة التي يقوم فيها برنامج Excel بسحره ويظهر ما إذا كان فريقك جيدًا كما هو أم يحتاج إلى المزيد من الأشخاص.
اكتب "تخطيط القدرات" في الخلية H1 (هذا هو اسم الجدول). كما في الخطوة السابقة، يمكنك وضع الجدول في أي مكان تريد، ولكن من المهم اتباع التعليمات بعناية لمنع استخدام الخلايا الخاطئة للصيغ.
إجمالي الطلب على المشروع
في الخلية H2، اكتب "إجمالي الطلب على المشروع" تمثل هذه الخلية الساعات التي يحتاجها فريقك ومديرو مشاريعك للاستثمار في جميع المشاريع مجتمعة. بدلًا من تشغيل الآلة الحاسبة وإضافة الأرقام يدويًا، ستستخدم قدرات Excel الخارقة. 🦸
انقر نقرًا مزدوجًا على الحقل H3 واضغط على أيقونة Fx على يسار شريط الصيغة. اختر "SUM" وحدد نطاق الخلايا التي يجب تضمينها في النتائج. في حالتنا، هذه هي الخلايا من B3 إلى B7، والنتيجة هي 384.
السعة المحتملة
تحتاج الآن إلى عرض عدد ساعات عمل فريقك في الأسبوع. ستحصل على ذلك بضرب عدد الموظفين في ساعات عملهم الأسبوعية.
يمكنك ترك برنامج Excel يقوم بالعمل نيابةً عنك واستخدام صيغة. ابدأ بكتابة "السعة المحتملة" في I2، وانقر نقرًا مزدوجًا على الخلية I3، واضغط على الزر Fx على يسار شريط الصيغة. تحت "البحث عن دالة"، أدخل "منتج"، وانقر نقرًا مزدوجًا فوق الدالة.
حدد الخليتين D3 و E3، وسيعرض Excel النتيجة في I3. في حالتنا، هذا هو 400.
السعة الفعالة
لننتقل إلى العمود الثالث. اكتب "السعة الفعالة" في J2 واستخدم صيغة لحسابها. ستشير هذه الخلية إلى عدد ساعات العمل المدفوعة التي يمكن لفريقك أن يقوم بها بالفعل. ستحصل على النتائج إذا قمت بضرب الأرقام الثلاثة من الجدول السابق (في حالتنا، الخلايا D3 و E3 و F3). والنتيجة هي 320.
الخطوة 4: احسب نقص الموارد ### الخطوة 4: حساب نقص الموارد

حدد ما إذا كنت بحاجة إلى تعيين موظفين وكم عدد الموظفين الذين تحتاج إلى توظيفهم لمواكبة المشاريع
هذه هي الخطوة الأخيرة والأكثر تعقيداً، حيث ستكتشف بعدها ما إذا كان فريقك يفتقر إلى الموارد (في هذه الحالة، القوى العاملة). ستحسب ذلك باستخدام معادلة فريدة من نوعها.
أولاً، أضف عمودًا جديدًا إلى جدول تخطيط السعة من الخطوة السابقة وأطلق عليه اسم "نقص الموارد"
الصيغة: الجزء 1
الآن، حان الوقت لاستخدام إحدى الدوال التي يشتهر بها Excel، وهي إذا. ستقوم بتعيين شرط سيعرض تلقائيًا ما إذا كنت بحاجة إلى المزيد من الموظفين في فريقك. ليس هذا فحسب، بل سيُظهر لك Excel عدد الموظفين الإضافيين الذين تحتاج إليهم!
في مثالنا، تبدو الصيغة كما يلي: “=IF(H3>J3,(H3-J3)/(E3*F3))”. تبدو معقدة؟ دعنا نشرحها بمزيد من التفصيل! 🤓
أولاً، أنت تركز على ما إذا كان إجمالي الطلب على المشروع أعلى من القدرة الفعالة للفريق (معبراً عنه بالساعات). في عالم مثالي، سيكون هذان الرقمان متساويين تقريباً. لكنك تدير فريقًا ديناميكيًا يتعامل مع مشاريع مختلفة - بعضها معقد ويتطلب المزيد من العمل.
وبغض النظر عن نطاق المشروع، إذا كان عدد الساعات اللازمة أسبوعيًا لمعالجة جميع المشاريع أعلى من القدرة الفعالة للفريق، فهذا يشير إلى أنك بحاجة إلى المزيد من أعضاء الفريق.
المعادلة: الجزء 2
لنفترض أن إجمالي الطلب على المشروع يتجاوز القدرة الفعالة لفريقك. في هذه الحالة، تحتاج إلى حساب عدد الموظفين الذين تحتاجهم، وبذلك نصل إلى الجزء الثاني من المعادلة.
ستقوم أولاً بتحديد الفرق بين إجمالي الطلب على المشروع والقدرة الفعالة (H3-J3). ثم ستضرب عدد ساعات العمل لكل موظف في معدل الاستخدام (E13 \ * F13).
نظرًا لوجود احتمال ألا تحصل على رقم زوجي ولا يمكنك توظيف 7.55 شخصًا بالضبط، ستحتاج إلى تقريب الرقم، ويجب عليك دائمًا استخدام الرقم الأعلى (في هذه الحالة، هذا هو 8).
في مثالنا هذا، ينقصنا شخصان بالضبط في فريقنا لضمان الإبحار السلس لجميع المشاريع. ⛵
الموارد ذات الصلة
إذا كنت ترغب في معرفة المزيد عن Excel ووظائفه، فإليك بعض النصائح الإضافية. 🤓
|[| /href/https://clickup.com/blog/excel-kpi-dashboard//How لإنشاء لوحة معلومات لمؤشرات الأداء الرئيسية في Excel/%href/](|-----------------------------------------------------------------------------------------------------------|) |
| | [undefined](|/href/https://clickup.com/blog/how-to-create-a-dashboard-in-excel///HowلإنشاءلوحةمعلوماتفيExcel/%href/) |%https://clickup.com/blog/how-to-create-a-dashboard-in-excel/How لإنشاء لوحة معلومات في Excel/%href/ |
| /href/https://clickup.com/blog/excel-calendar//How لإنشاء تقويم في Excel/%href/ |
| [| | /href/https://clickup.com/blog/kanban-board-in-excel//How لإنشاء لوحة كانبان في Excel/%href/](||/href/https://clickup.com/blog/gantt-chart-excel//HowلإنشاءمخططجانتفيExcel/%/|href/|) |
| /href/https://clickup.com/blog/org-chart-excel///How لإنشاء مخطط هيكلي في Excel/%href/ |%https://clickup.com/blog/org-chart-excel/How لإنشاء مخطط هيكلي في Excel/%/ |href/ |
| /href/https://clickup.com/blog/google-sheets-vs-excel//Google جداول البيانات مقابل Excel: 2023 مقارنة بين 2023/%href/ ||
| [undefined](|/href/https://clickup.com/blog/create-a-timeline-in-excel//HowلإنشاءجدولزمنيللمشروعفيExcel/%href/) |
| [](|/href/https://clickup.com/blog/how-to-make-a-graph-in-excel//HowلإنشاءرسمبيانيفيExcel/|%/href/|) الخاص بهم |https://clickup.com/blog/project-deliverables/deliverables/%href/ بناءً على الفرق التي يديرونها لمراقبة السعة |
| عبء عمل الفريق | سرد منسقي المشاريع ومهامهم، ولكن هذه المرة فقط، ترتبط المهام بعملاء محددين |
| منسقو المشاريع | تقديم نظرة عامة على منسقي المشاريع والمهام في شكل لوحة كانبان |
| العملاء | عرض تفاصيل كل مشروع (تواريخ البدء والاستحقاق، والميزانيات المخصصة والتكاليف الفعلية، وأسماء منسقي المشروع، والمزيد)، مرتبة حسب العملاء
| جانت النشاط | عرض الجداول الزمنية لجميع المهام لمنع التداخلات وضمان توزيع أعباء العمل بالتساوي |
| الجدول الزمني | تجميع المهام حسب العملاء وترميز حالتها بالألوان في شكل تقويم |
| لوحة | فرز المهام بناءً على حالتها في لوحة كانبان |
اجمع بين جميع طرق العرض هذه، وستحصل على قالب تخطيط شامل لقدرات المشروع داخل الفرق والأقسام. تنزيل هذا القالب
3. قالب تخصيص الموارد ClickUp

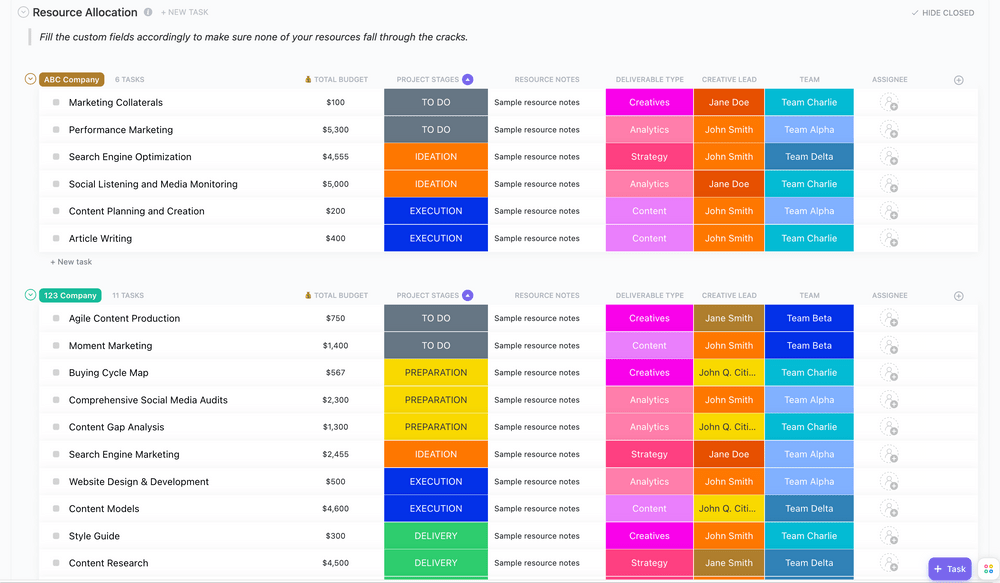
استخدم نموذج تخصيص الموارد الخاص ب ClickUp لتتبع القوى العاملة والمواد المطلوبة للمشروع
تخصيص و إدارة الموارد يمكن أن تكون صعبة وغير ناجحة إذا لم تكن تستخدم الأدوات المناسبة. إن قالب تخصيص الموارد ClickUp هو اختصار يساعدك على تحليل وفهم الموارد المتاحة اليوم للتخطيط للمستقبل.
إليك لماذا يمكن أن يكون هذا القالب سلاحاً قوياً في ترسانتك:
- يساعدك على تسليم جميع المشاريع في الوقت المحدد
- يجعل الموظفين أكثر تحفيزًا
- يساعد على تحسين أداء الموظفين وزيادة الكفاءة إلى أقصى حد
كغيره من نماذج تخطيط سعة موارد ClickUp الأخرى، يمنحك هذا النموذج رفاهية تعدد طرق العرض. من خلال عرضي عبء عمل الفريق وعبء عمل قائد الفريق، ستحصل على رؤية مفصلة عن عبء العمل لكل عضو من أعضاء فريقك. قم بتصفية أعباء العمل استنادًا إلى التواريخ والحالة والأولوية والمكلفين والمراحل الرئيسية واحصل على المعلومات المطلوبة ببضع نقرات. هذا مفيد بشكل خاص لمديري المشاريع الذين لديهم فرق عمل أكبر.
يوفر القالب أيضًا عرضين للقائمة -حسب العملاء والمشاريع. استخدمها لتجميع مهامك بناءً على العميل/المشروع ومراجعة تواريخ الاستحقاق والأولويات والميزانية الإجمالية والتفاصيل الأخرى.
أخيرًا، لديك طريقة عرض عملية التسليم، وهي لوحة كانبان تعرض مشاريعك ومراحلها. تنزيل هذا القالب
طريقة أفضل لإظهار تخطيط السعة
قوالب تخطيط السعة التي ناقشناها ليست سوى غيض من فيض إدارة مشروع ClickUp. 🧊
على سبيل المثال، استخدم نبض انقر فوق التطبيق للحصول على معلومات قيّمة عن نشاط فريقك خلال يوم العمل. فهو يتيح لك معرفة من المتصلين بالإنترنت في أي وقت وما الذي يعملون عليه.
ميزة أخرى قيّمة لتخطيط القدرات هي مستندات ClickUp . يمكنك استخدامه لتحديد نطاق المشروع وتحديد متطلبات السعة. بمجرد إنشاء مستند، يمكنك إرفاقه بالمشروع والعودة إليه في أي وقت إذا احتجت إلى إجراء تغييرات.
هل تريد أن تستفيد من مزايا تخطيط السعة دون إضاعة ساعات في إنشاء المخططات وإنشاء الصيغ في Excel؟ بفضل طرق العرض المتعددة، والقوالب سهلة الاستخدام، والتعليمات التفصيلية، يضعك ClickUp خلف عجلة القيادة ويتيح لك الاطلاع بسهولة على قدرة فريقك في أي وقت! 💪

