سواء كنت تضع الخطوط العريضة لكتاب، أو تقوم ببناء سير العمل، أو تقوم بالعصف الذهني لرحلة عميل - فأنت تستخدم مخططًا لإنجاز ذلك.
تُعد المخططات موارد حيوية في تقديم المعلومات بصريًا وتساعد في تسهيل التواصل الواضح للأفكار عبر الفرق والأقسام وحتى الشركات بأكملها!
نحن جميعًا نستوعب المعلومات بشكل مختلف، ومع ظهور اللوحات الرقمية وأدوات الرسم التخطيطي, والمخططات الانسيابية فإن المزيد من المديرين يدركون الحاجة إلى إدخال برامج مرئية للغاية في مجموعات التقنيات الخاصة بهم لدعم كل أسلوب العمل الأكثر إنتاجية لدى كل عضو.
_اثنتان من أكثر الأدوات شيوعًا في هذه الفئة؟
ولكن لمجرد كونهما من أكثر البرامج استخدامًا لا يعني أنهما الأفضل في السوق أو لفريقك - وقد جئت إلى المكان المناسب لحل هذه المشكلة!
تابعنا بينما نتعمق في كل ما تحتاج إلى معرفته عن برنامجي Draw.io و Lucidchart مع تفاصيل تفصيلية لأهم ميزاتهما، وحالات الاستخدام، والأسعار. بالإضافة إلى ذلك، يمكنك الوصول إلى برنامج تخطيطي آخر قابل للتخصيص وديناميكي لسد كل فجوة يتركها Draw.io و Lucidchart مفتوحة.

ما هو Draw.io؟ Draw.io هو برنامج رسم تخطيطي قوي يساعد الفرق على التعاون باستخدام الرسوم البيانية. وبفضل ميزاته السهلة الاستخدام، يمكن للمستخدمين إنشاء مرئيات ذات مظهر احترافي بسرعة لدعم مشاريعهم واتصالاتهم.
يوفر Draw.io واجهة سهلة الاستخدام لتصميم وإنشاء مخططات عالية الجودة بعناصر متعددة، مثل الأشكال والأسهم والجداول ومربعات النصوص والصور. بالإضافة إلى ذلك، يتضمن البرنامج مجموعة كبيرة من القوالب المدمجة لتبسيط عملية الرسم التخطيطي.
يسهل Draw.io على الفرق العمل معًا على المخططات المعقدة من خلال السماح لعدة أشخاص بالتعاون عبر الإنترنت في الوقت الفعلي. باستخدام هذه الميزة، يمكن للمستخدمين بسهولة إضافة كائنات إلى رسم تخطيطي أو تحرير محتواه أو إضافة تعليقات وتعليقات توضيحية.
تنعكس جميع التغييرات على الفور في النسخة المشتركة من المخطط، بحيث يعرف الجميع ما يحدث بالضبط. 👥
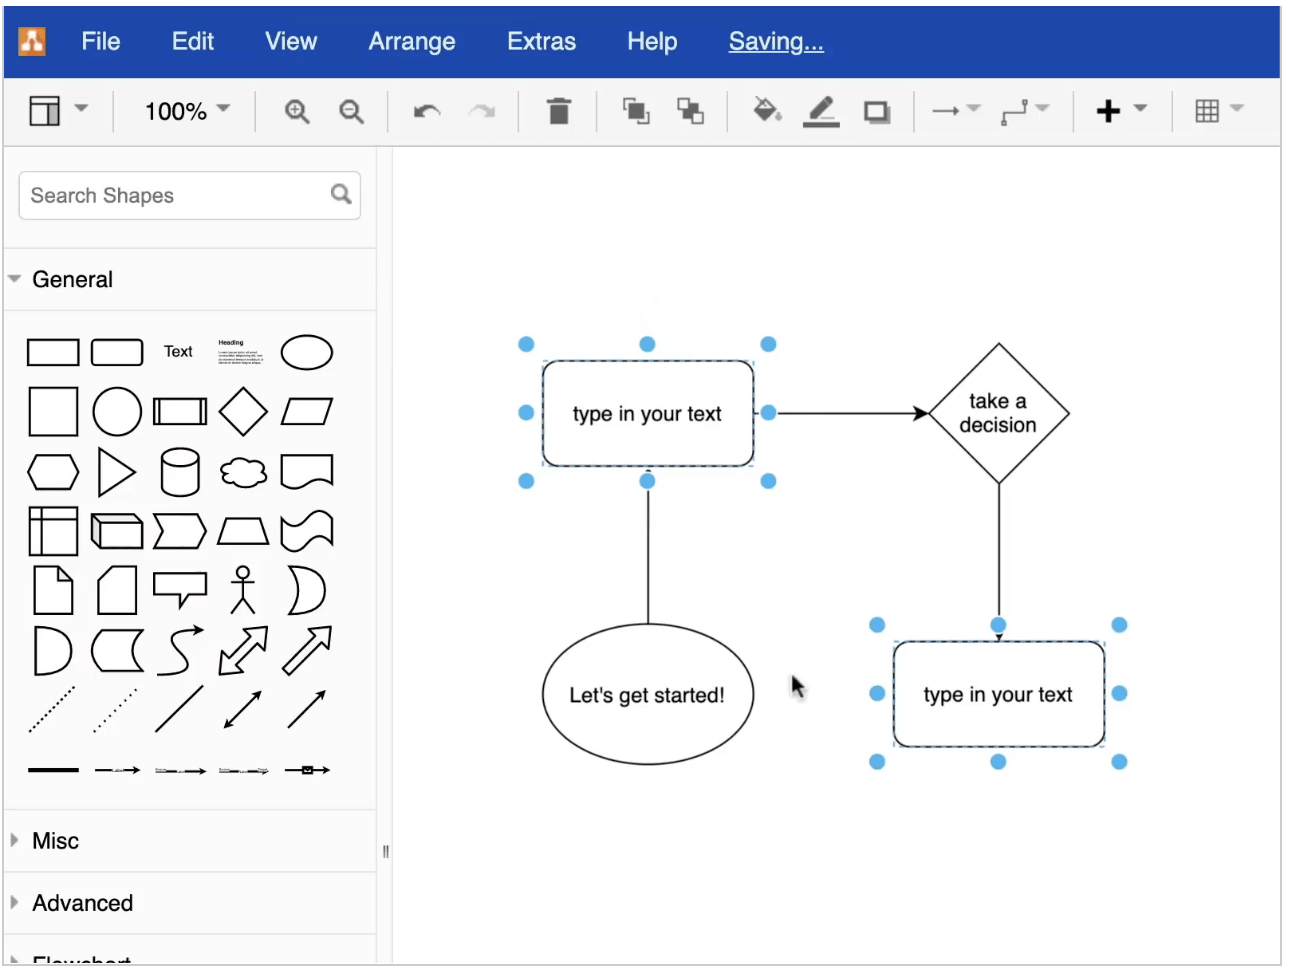
عبر Draw.io
ما هو Lucidchart؟ لوسيدشارت هو موقع على الإنترنت
أداة للرسم التخطيط والتصور التي تسهل على الفرق إنشاء ومشاركة تمثيلات مرئية لأفكارهم. باستخدام Lucidchart، يمكن للفرق إنشاء مخططات بيانات ذات مظهر احترافي بسرعة و مخططات التدفق التراكمي في دقائق - دون الحاجة إلى مهارة فنية أو ترميز.
من المخططات الانسيابية ومخططات الشبكة إلى المخططات التنظيمية وخطط المشاريع، يسمح Lucidchart للفرق بتصور المعلومات المعقدة بطريقة يسهل فهمها. مع التعاون في الوقت الحقيقي ميزات، يمكن لأعضاء الفريق العمل معًا على نفس المستند، مما يؤدي إلى إنشاء سير عمل مبسط مع الوضوح والتوجيه.
يتكامل لوسيدتشارت أيضًا مع البرامج الشائعة مثل Jira و Confluence و Google Apps، مما يجعل استخدامه أسهل. مع لوسِدكارت، يمكن للفرق التحرك بشكل أسرع واتخاذ قرارات أفضل. ✨
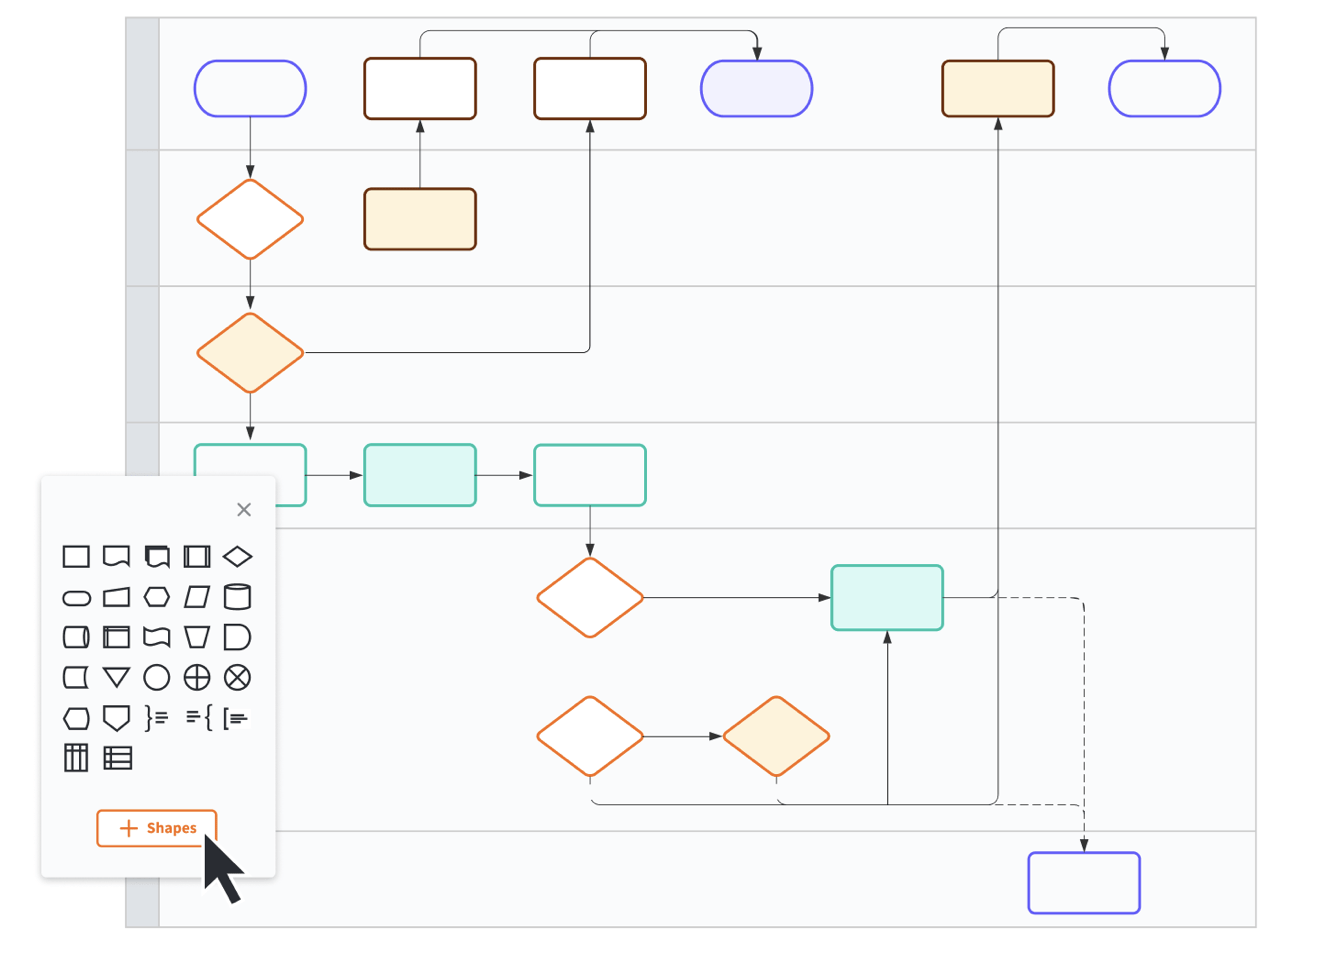
عبر لوسيدتشارت هل أنت مستعد للقيام ببعض الحديث التقني؟ لنستعرض مقارنة الميزات بين Draw.io و Lucidchart. ما الذي يميزهما عن بعضهما البعض؟ كلتا الأداتين خياران رائعان لتصميم مخططات جميلة. ومع ذلك، فإن أدوات التحرير الخاصة بهما تجعلهما أكثر ملاءمة لمهام معينة.
_تحقق من هذه قوالب مخطط السياق !
Draw.io مقابل Lucidchart: مقارنة الميزات
يشبه استخدام أداة رسم تخطيطي مثل Draw.io أو Lucidchart تعلم لغة جديدة. كلتا الأداتين تقدمان ميزات وفوائد متشابهة، ولكن لكل منهما هيكلها الفريد. إن تعلم أي من أدوات الرسم التخطيطي هذه يشبه إتقان أي لغة أخرى: يتطلب الأمر الممارسة والصبر، لكن المكافآت تستحق العناء!
القوالب
Draw.io أداة قوية للغاية لإنشاء المخططات الانسيابية والرسوم البيانية وأنواع أخرى من المحتوى المرئي. ومع ذلك، يمكن أن يمثل تعلم الواجهة تحديًا نظرًا لوجود العديد من الميزات والقوائم التي يجب استكشافها. 🎒
علاوة على ذلك، إذا كنت تعمل على مخطط معقد وتحتاج إلى إدراج عناصر أو نقل عناصر بسرعة، فمن المفيد أن تكون لديك معرفة بالعناصر أو الأشكال، حتى لا تضطر إلى التمرير عبر القائمة بأكملها. 🖱
كل هذه الخطوات المطلوبة يمكن أن تجعل Draw.io يبدو مربكًا للمستخدمين لأول مرة الذين ليس لديهم خلفية تقنية.

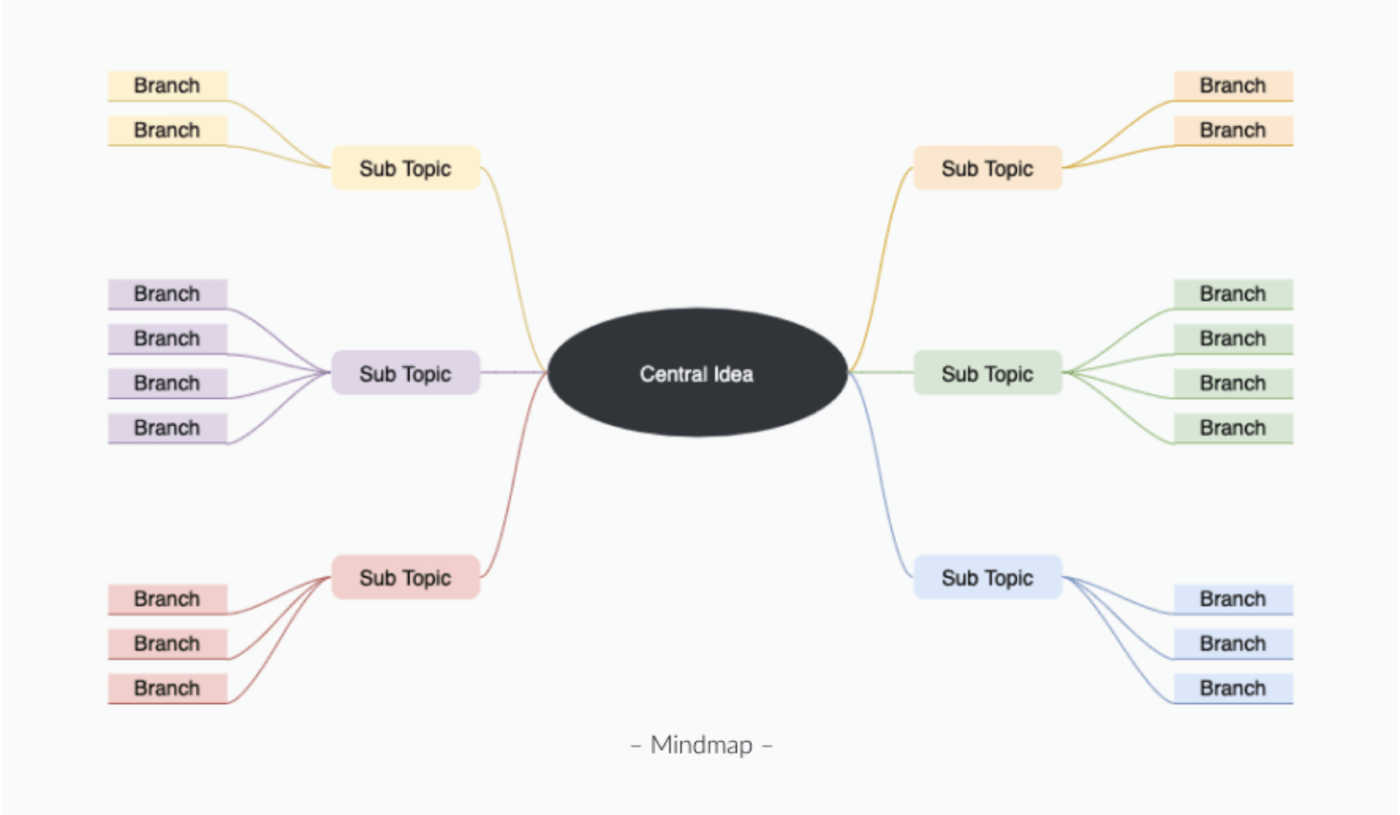
عبر Draw.io اكتشف المزيد أمثلة على الخريطة الذهنية !
وظائف استيراد الملفات وتصديرها
يسهل Draw.io العمل مع تنسيقات الملفات المختلفة. تتيح لك وظائف الاستيراد والتصدير الخاصة به نقل الرسومات والمخططات والمخططات الانسيابية التي تقوم بإنشائها بسهولة من تنسيق ملف إلى آخر. إذا كنت بحاجة إلى طباعة رسم تخطيطي، يمكنك إما أن تختار وضعه على صفحة واحدة أو عدة صفحات.
فيما يلي تنسيقات الملفات المتاحة في Draw.io:
جدول تنسيقات ملفات الاستيراد والتصدير الخاصة بـ Draw.io
| تنسيقات الاستيراد | تنسيقات التصدير | |
|---|---|---|
| . | .xml (Draw.io) | .VSDX (Microsoft Visio) |
| .gliffy (Gliffy) | JPEG | |
| .json (Lucidchart) | SVG | |
| .vsdx (Microsoft Visio) | ||
| .png (مع XML) | PNG | |
| .jpeg | HTML | |
| .svg | XML | |
| .csv | URL |
فيما يلي تنسيقات الملفات المتاحة لدى Lucidchart:
جدول تنسيقات ملفات الاستيراد والتصدير الخاصة بـ lucidchart
| تنسيقات الاستيراد | تنسيقات التصدير | |
|---|---|---|
| /href//blog?p=5222222 مايكروسوفت فيزيو (.vdx و .vsdx و .vsd) | %href/ | Microsoft Visio 2010 (VDX) أو VSDX |
| OmniGraffle (.graffle, .graffle.zip) | ملف CSV لبيانات الشكل | |
| Gliffy (.gxml, .gliffy) | JPEG | |
| Draw.io ( .xml) | SVG | |
| PNG |
الفائز: اختيار اللاعب! ♠️
اعتمادًا على التطبيقات التي تستخدمها، يقدم Draw.io أو Lucidchart مجموعة متنوعة من التنسيقات لنقل البيانات من برنامج إلى آخر.
أدوات التحرير
توفر أدوات التحرير في Draw.io طريقة بديهية لإنشاء مخططات تفصيلية ومخططات انسيابية ومخططات أرضية. وبفضل مكتبة العناصر الشاملة، يمكنك تخصيص الأشكال، وتجميع العناصر معًا، وإضافة نص، والمزيد. بالإضافة إلى ذلك، يمكنك تطبيق الألوان والأنماط على مخططاتك لمزيد من الوضوح والتأثير البصري. 🤩
إن تعدد استخدامات أدوات التحرير في Draw.io يجعلها مثالية لمشاريع الرسم التخطيطي الفنية والإنشائية. من الرسومات التخطيطية الأساسية إلى الرسوم التوضيحية المعقدة، هناك دائمًا شكل أو خط مثالي لمخططك!

عبر Draw.io تجعل واجهة Lucidchart ووظيفة السحب والإفلات من إنشاء المخططات مباشرة، مع القدرة على تغيير حجم الأشكال والتلاعب بها بسهولة. يمكن للفرق أيضًا التعاون على نفس المستند في الوقت الفعلي ورؤية إصدارات العمل من الرسم التخطيطي أثناء تقدمهم! 🌱
يحتوي Lucidchart على مكتبة من الكائنات المدمجة مثل الأسهم والخطوط والمخططات التي يمكن للفرق استخدامها بسرعة لتوضيح أفكارهم. بهذه الطريقة، يمكن للجميع تصور نقاط القوة والضعف في مؤسستهم واتخاذ الإجراءات اللازمة.
أخيرًا، يوفر Lucidchart للمستخدمين تحليلات مفصلة حول مخططاتهم حتى تتمكن الفرق من تتبع التغييرات بسهولة مع مرور الوقت. وهذا يساعدهم على اكتشاف الاتجاهات قبل أن تتفاقم ويجعل اكتشاف المشكلات أسهل من أي وقت مضى. مع أدوات تحرير Lucidchart، يمكن للفرق تصور عملياتهم واتخاذ قرارات قائمة على البيانات بشكل أسرع.

عبر لوسيدتشارت الفائز: لوسيدتشارت 🛠
هناك منحنى تعليمي حاد لفهم قائمة Draw.io وميزاته.
في النهاية، يعد كل من Draw.io و Lucidchart أدوات تخطيطية شاملة تقدم قيمة لمستخدميها. يعد Draw.io خيارًا رائعًا لأولئك الذين يحتاجون إلى حل تقني موجه للأعمال، بينما يعد Lucidchart مثاليًا لأولئك الذين يحتاجون إلى وظائف إضافية مثل التعاون المباشر والواجهة السهلة. يمكن استخدام كلا التطبيقين لإنشاء رسوم بيانية مذهلة بصرياً!
Draw.io مقابل Lucidchart: التسعير والأمان
يمكن أن يكون استكشاف خطط التسعير وميزات الأمان لكل من Draw.io و Lucidchart مثل البحث عن الكنز. كلا المنتجين يقدمان أدوات شاملة مصممة خصيصاً لتلبية احتياجاتك وميزانيتك، مع بعض الخيارات التي تقدم طبقات إضافية من الحماية وراحة البال. دعنا نلقي نظرة فاحصة! 🔎
عبر Draw.io
خطط التسعير
بينما يقدم كل من Draw.io و Lucidchart خططًا مجانية رائعة للاستخدام العرضي، فإن الترقية إلى خطة مدفوعة يمكن أن تفتح المزيد من الميزات المصممة للاستخدام اليومي.
تسعير #### Draw.io
قم بزيارة سوق Atlassian Marketplace للحصول على تفاصيل وميزات إضافية للتسعير. أمثلة على التسعير:
- إصدار مجاني
- حتى 10 مستخدمين
- خطة سحابية
- 15 دولارًا شهريًا ل 20 مستخدمًا
- 450 دولارًا شهريًا ل 2,000 مستخدم
- خطة مركز البيانات
- 6,000 دولار شهرياً ل 500 مستخدم
- 10,000 دولار شهرياً ل 2,000 مستخدم
- خطة الخادم
- اتصل ب Draw.io لمعرفة الأسعار
تسعير لوسيدتشارت
- إصدار مجاني
- 3 مستندات Lucidchart قابلة للتحرير
- 60 شكلاً لكل مستند Lucidchart
- 100 قالب
- خطة فردية (7.95 دولار)
- مستندات غير محدودة قابلة للتحرير
- كائنات غير محدودة لكل مستند
- 1 غيغابايت من التخزين، والمزيد
- خطة الفريق (9.00 دولارات لكل مستخدم)
- نشر محمي بكلمة مرور
- التعليق
- سجل المراجعة مع الإصدار، والمزيد
- خطة المؤسسة (اتصل بلوسِدتشارت للتسعير)
- مجلدات الفريق
- حالة المستند القابلة للتخصيص
- مصادقة SAML، والمزيد

عبر لوسيدتشارت هل تبحث عن حل قاعدة بيانات يقدم كل شيء؟ لا تبحث أكثر من ClickUp! إنه النظام الأساسي المثالي للإنتاجية مع المرونة والتخصيص والأمان - وهو بالضبط ما تحتاجه لتشغيل فريقك. ⚡️
تعرّف على ClickUp - أداة التخطيط المثالية
يمكن أن تساعد كل من مخططات Draw.io و Lucidchart فريقك على دمج الممارسات المرئية في عمليات إدارة مشروعك اليومية، ولكنك ستظل بحاجة إلى الاعتماد على أدوات أخرى لتجاوز فكرتك إلى خط النهاية.
ما لم تكن تستخدم انقر فوق . 🙂
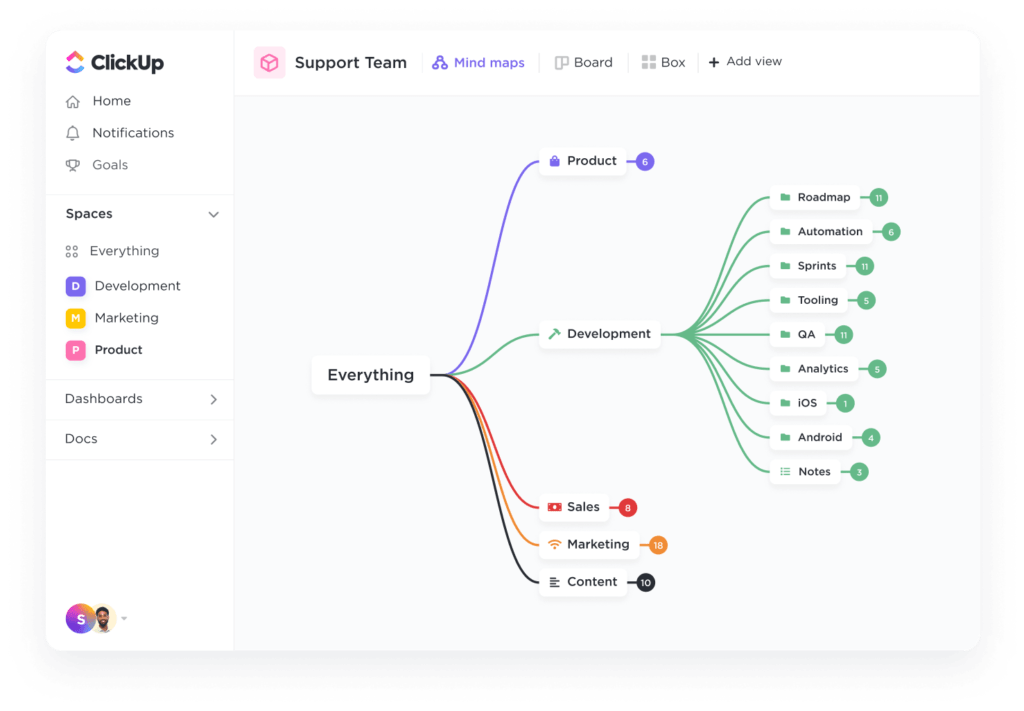
قم بتخطيط وتنظيم المشاريع أو الأفكار أو المهام الحالية في ClickUp للحصول على مخطط تفصيلي مرئي مثالي
ClickUp هو برنامج قوي متعدد الإمكانات أداة إنتاجية مع المئات من الميزات المرنة والتعاونية والبديهية لتبادل الأفكار وتطويرها وتقديم مشاريعك من منصة مركزية واحدة. بالإضافة إلى ذلك، فهي الأداة الوحيدة التي يمكنها تحويل الأفكار وربطها مباشرةً بسير عملك باستخدام ميزات مثل ClickUp Mind Maps وخرائط العقل المدمجة برنامج السبورة الرقمية .
من بين برامج ClickUp الغنية مجموعة من الميزات ستجد أكثر من 15 طريقة عرض فريدة للمشروع لتصور عبء العمل الخاص بك من جميع الزوايا، بما في ذلك طرق عرض القائمة والتقويم وجانت وطريقة عرض لوحة كانبان. الكشف الفوري والمباشر في ClickUp يجعل تعاون الفريق سهلاً - ولا نعني فقط من محرر المستندات الخاص به, مستندات ClickUp ! شاهد متى يقوم الأعضاء بالكتابة داخل مهمة ما، وتحديث حالات المهام المخصصة، وإضافة التعليقات، والمزيد.
وهذا ليس حتى نصفها!!
تجعل ميزات ClickUp التخطيطية من ClickUp جلسات العصف الذهني أكثر قيمة وخطواتك التالية أكثر وضوحًا بمساعدة لوحات ClickUp البيضاء والخرائط الذهنية وعرض مخطط جانت، وسنوضح لك ذلك.
سبورات بيضاء رقمية تعاونية
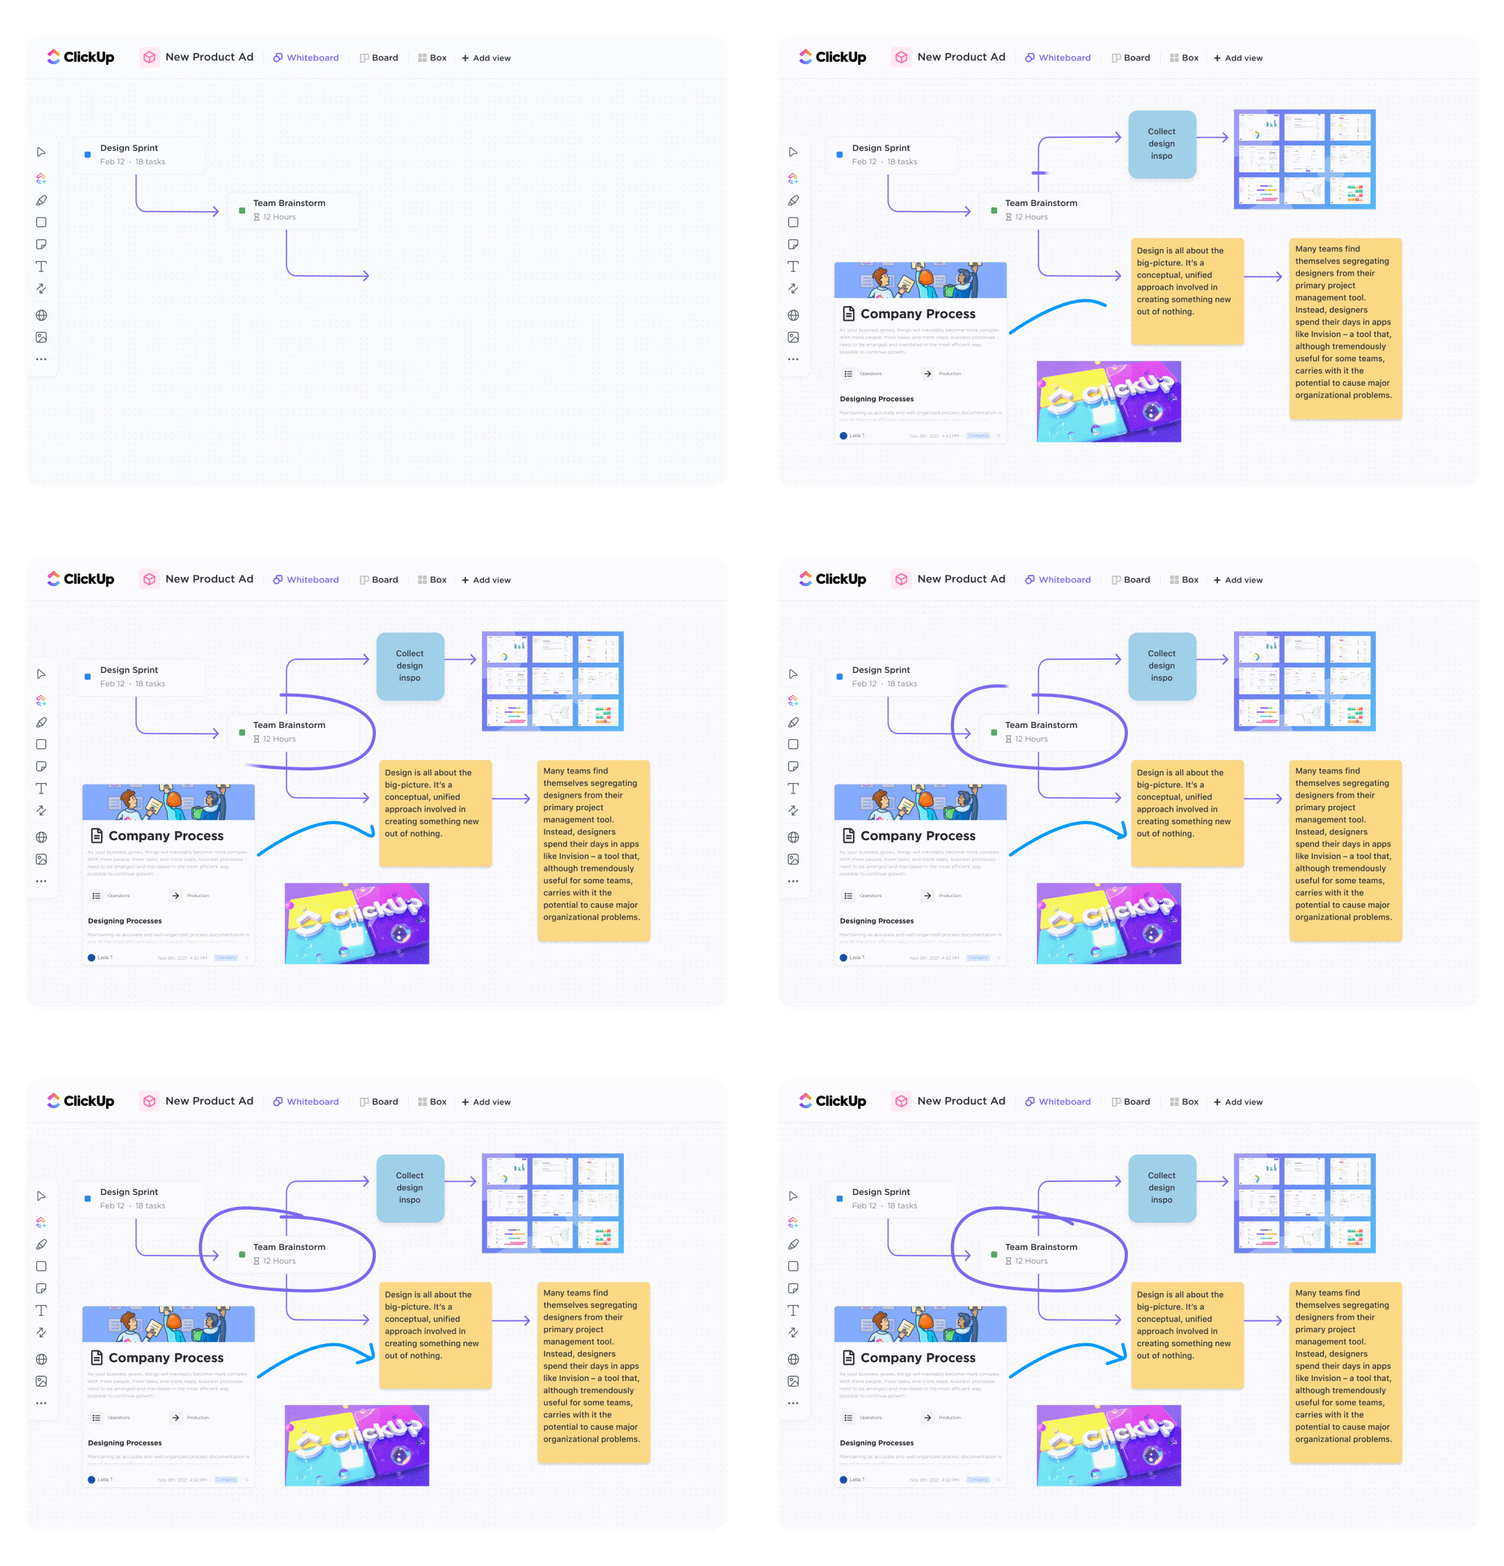
ارسم الروابط واربط العناصر معًا لإنشاء خرائط طريق أو سير عمل من أفكارك مع فريقك في ClickUp Whiteboards
تخيل التقاط الأفكار الجديدة ووضع استراتيجيات تطويرها ورسم خرائط سير العمل من نفس اللوحة القماشية اللانهائية - هذه هي اللوحات البيضاء بالنسبة لك. 🙌🏼 اللوحات البيضاء في ClickUp تم تصميمها لمساعدة فريقك على تحويل المفاهيم إلى عمل بشكل أسرع، مع أدوات للرسم وإضافة الملاحظات وربط الوسائط ذات الصلة وربط الأفكار مع الفريق باستخدام التحرير المباشر التعاوني.
تعرّف على من يشاهد لوحتك، ومن يضيف معلومات جديدة، والحالة الفورية لأي مهمة ذات صلة، كل ذلك في لمحة واحدة - وهذا جزء مما يجعل إدارة مشروع اللوحة البيضاء فعالة جداً
ولكن ما يجعل سبورة ClickUp Whiteboards فريدة من نوعها وقيّمة للغاية هو قدرتها على تحويل أي شكل على لوحتك مباشرةً إلى مهمة قابلة للتنفيذ. لذا يمكنك دائمًا الاستمرار في التركيز على الهدف النهائي في متابعة الخطوات التالية، حتى بعد انتهاء الاجتماع.

قم بتحويل الأشكال إلى مهام على لوحة ClickUp Whiteboard لبدء وضع المخطط الانسيابي الخاص بك موضع التنفيذ على الفور
بالإضافة إلى ذلك، تقدم ClickUp الكثير من قوالب السبورة البيضاء المجانية للرسوم البيانية والمخططات الانسيابية والمزيد! حيث يتم وضعها فوق لوحتك النظيفة لبدء أي عملية بأقصى قدر من الكفاءة.
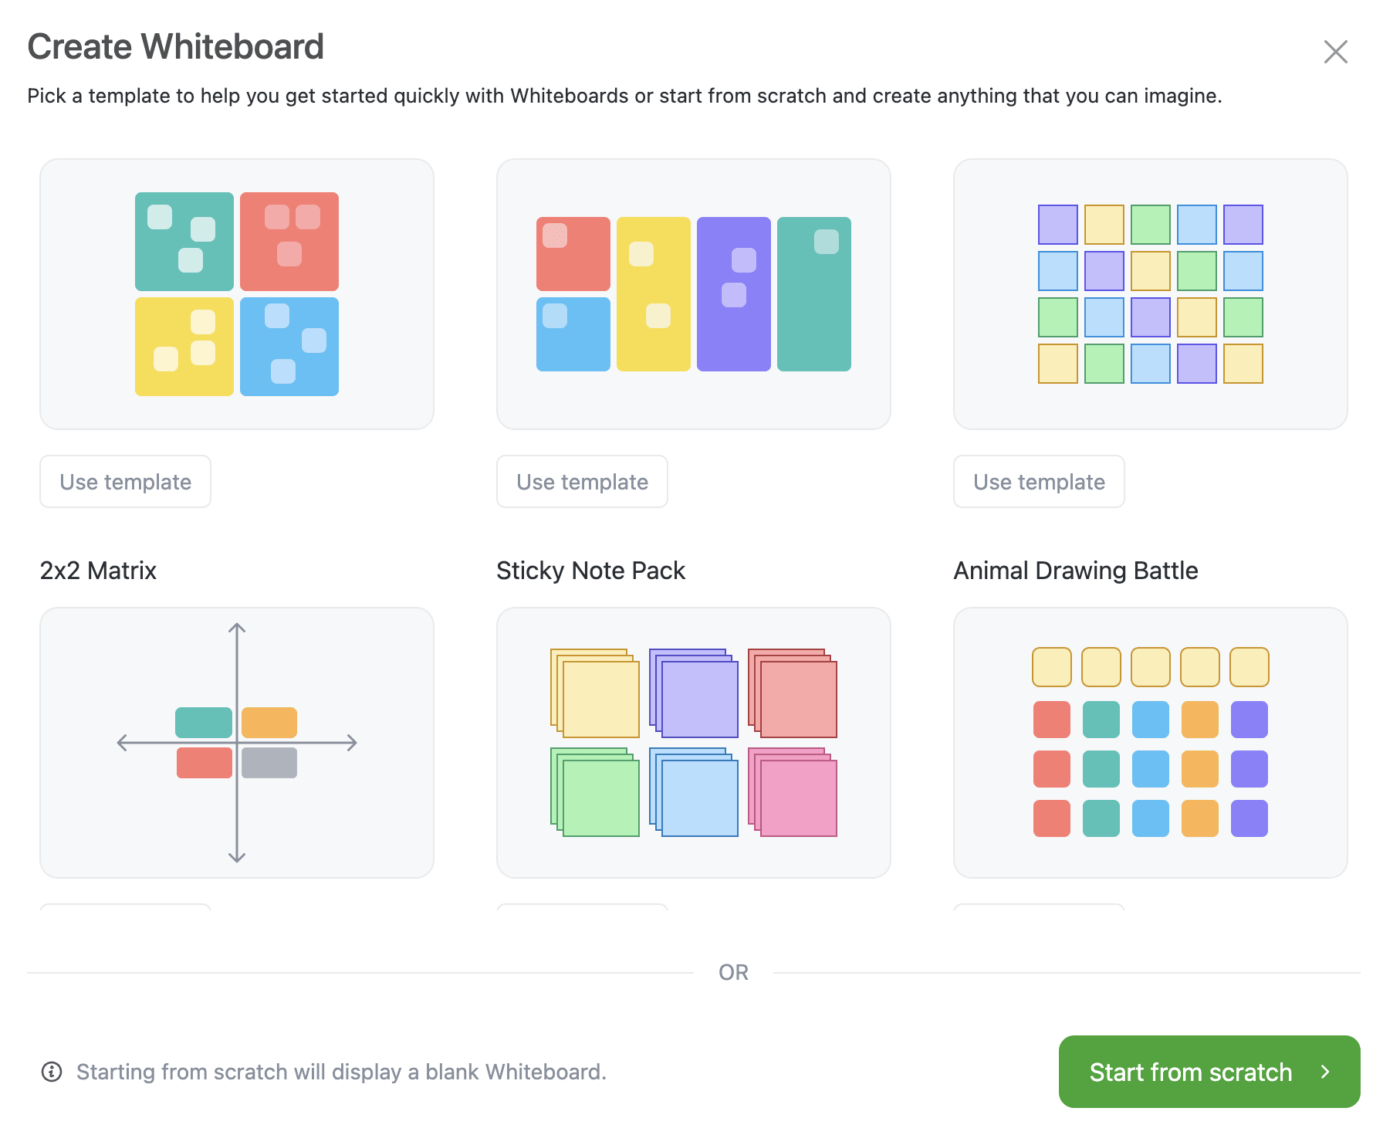
عند إعداد طريقة عرض السبورة البيضاء، لديك العديد من القوالب للاختيار من بينها
أوه، وهل ذكرنا أن _أول ثلاث لوحات بيضاء مجانية تمامًا في ClickUp؟
خرائط ذهنية بديهية الخرائط الذهنية في ClickUp هي الحل لتنظيم كل تفريغ ذهني وجلسة أفكار ومشروع في مخطط مرئي منطقي وفعال.
قسّم الأفكار المعقدة إلى عملية واضحة خطوة بخطوة أو اعمل من خلال سيناريوهات مختلفة للوصول إلى نفس الهدف النهائي باستخدام العقد التي تتحول إلى مهام ClickUp!
اربط المهام مباشرةً بـ الخريطة الذهنية أو قم بإنشائها على الفور باستخدام وضع المهام، أو لديك خيار بناء مخطط حر الشكل من الصفر باستخدام الوضع الفارغ.

قم بتطوير الأفكار مع الفريق من خلال رسمها في خريطة ذهنية حرة باستخدام الوضع الفارغ في ClickUp
كما هو الحال في السبورات البيضاء، يمكنك معرفة من يشاهد خريطتك الذهنية ويساهم فيها في أي وقت، يمكنك مشاركة مخططك باستخدام رابط بسيط.
تحقق من
_/مرجع/ مدونة؟ p=13794 برنامج رسم الخرائط الذهنية *%/href/_
!
مخططات جانت الجميلة
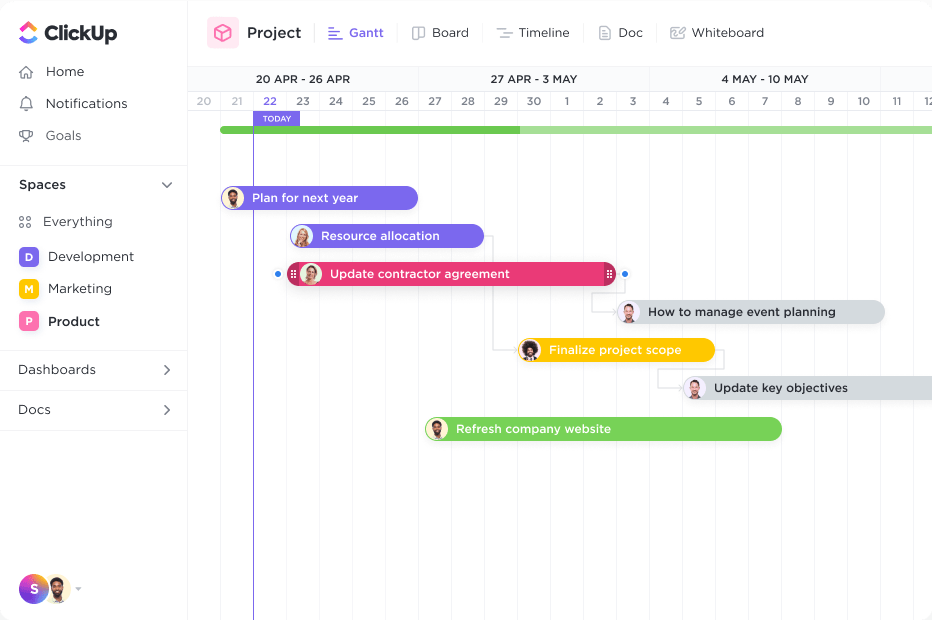
تخطيط المشاريع وإدارة التبعيات وتحديد أولويات المهام باستخدام عرض جانت في ClickUp
وفوق ذلك كله، فإن ClickUp الديناميكية عرض جانت هو مورد مخطط جانت المثالي لجدولة المهام، وإدارة التبعيات، وإرشاد الفريق إلى الأولويات القصوى باستخدام جدول زمني مرن.
يجعل عرض جانت إدارة الوقت أسهل وأكثر مرئية مع جداول زمنية قابلة للتعديل مصممة لمساعدتك على الوفاء بالمواعيد النهائية وتجنب الاختناقات في كل خطوة على الطريق. أنشئ التبعيات ببساطة عن طريق رسم علاقة بين مهمتين، واحصل على عرض عالي المستوى لحالة مشروعك الإجمالية باستخدام النسب المئوية للتقدم، وغير ذلك الكثير، كل ذلك من طريقة عرض واحدة.
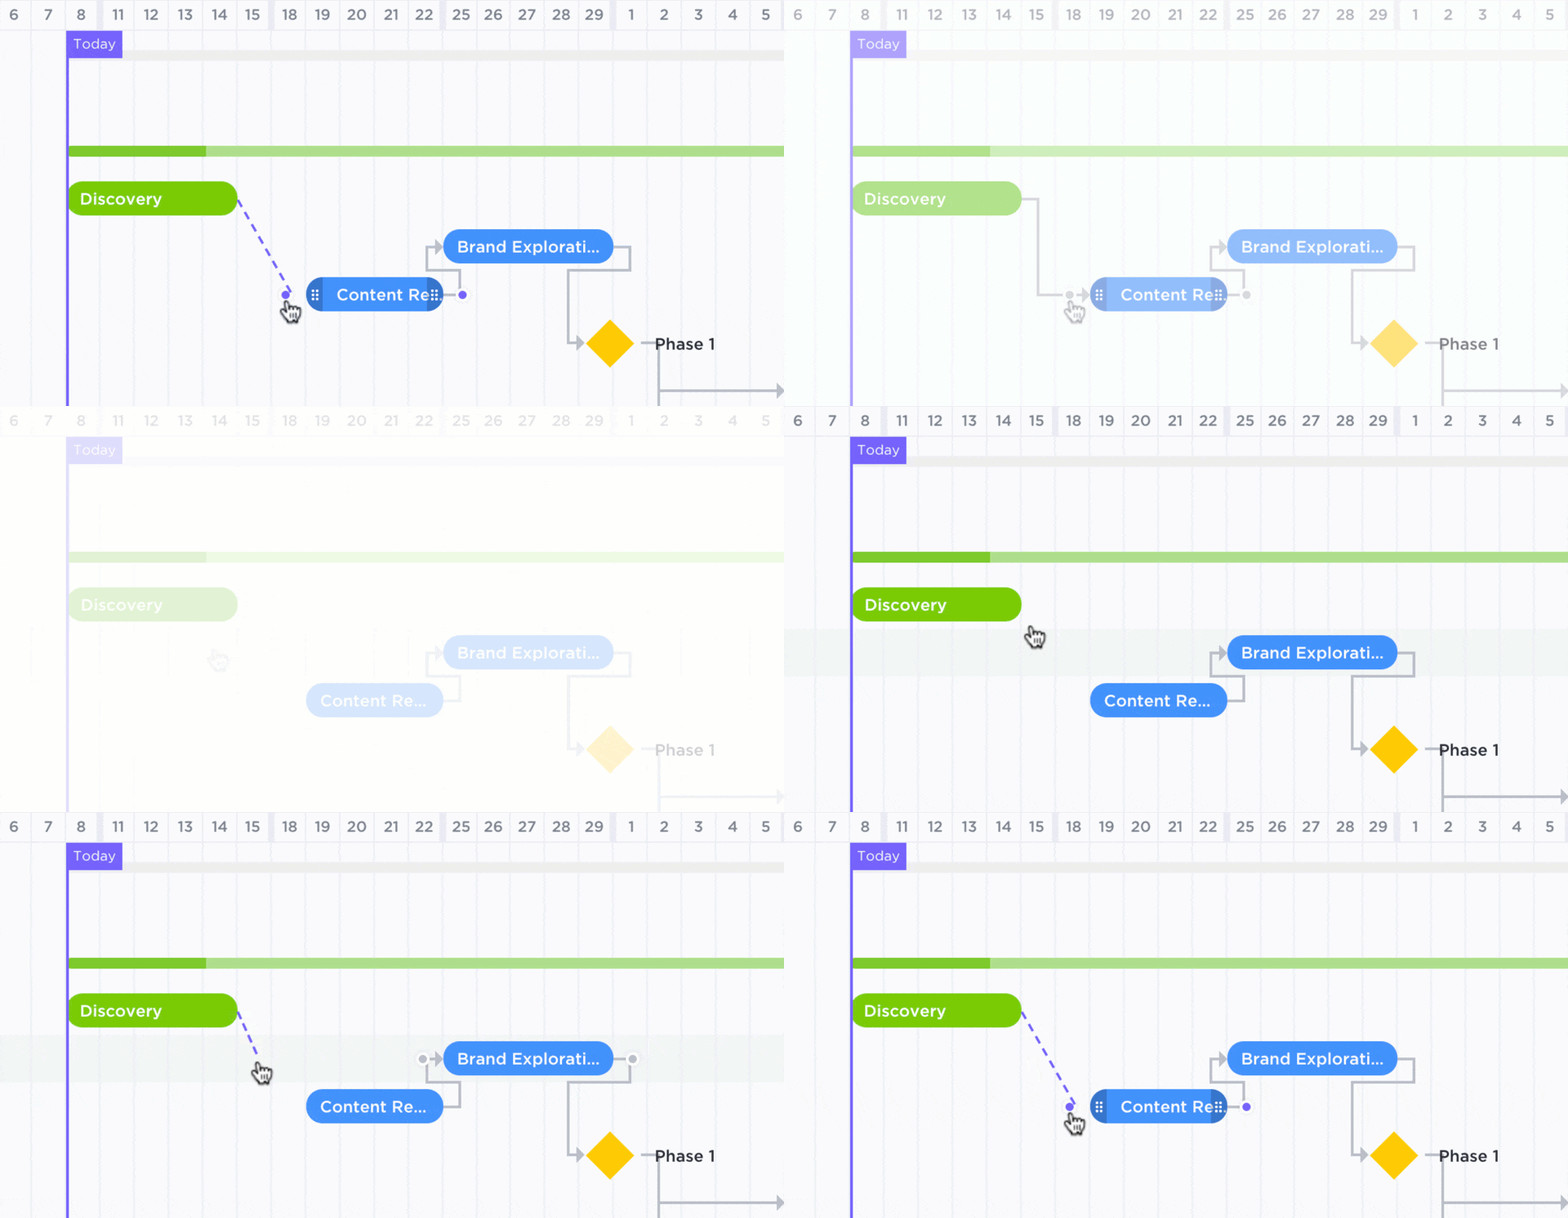
إظهار العلاقات بين المهام والمهام المتطلبة في طريقة عرض جانت في ClickUp
يمكنك أيضًا حساب المسار الحرج لتصور المعالم الرئيسية، وفرز عناصر العمل مع خيارات مرمزة بالألوان لمعرفة ما يحدث بالضبط ضمن مهامك في أي وقت.
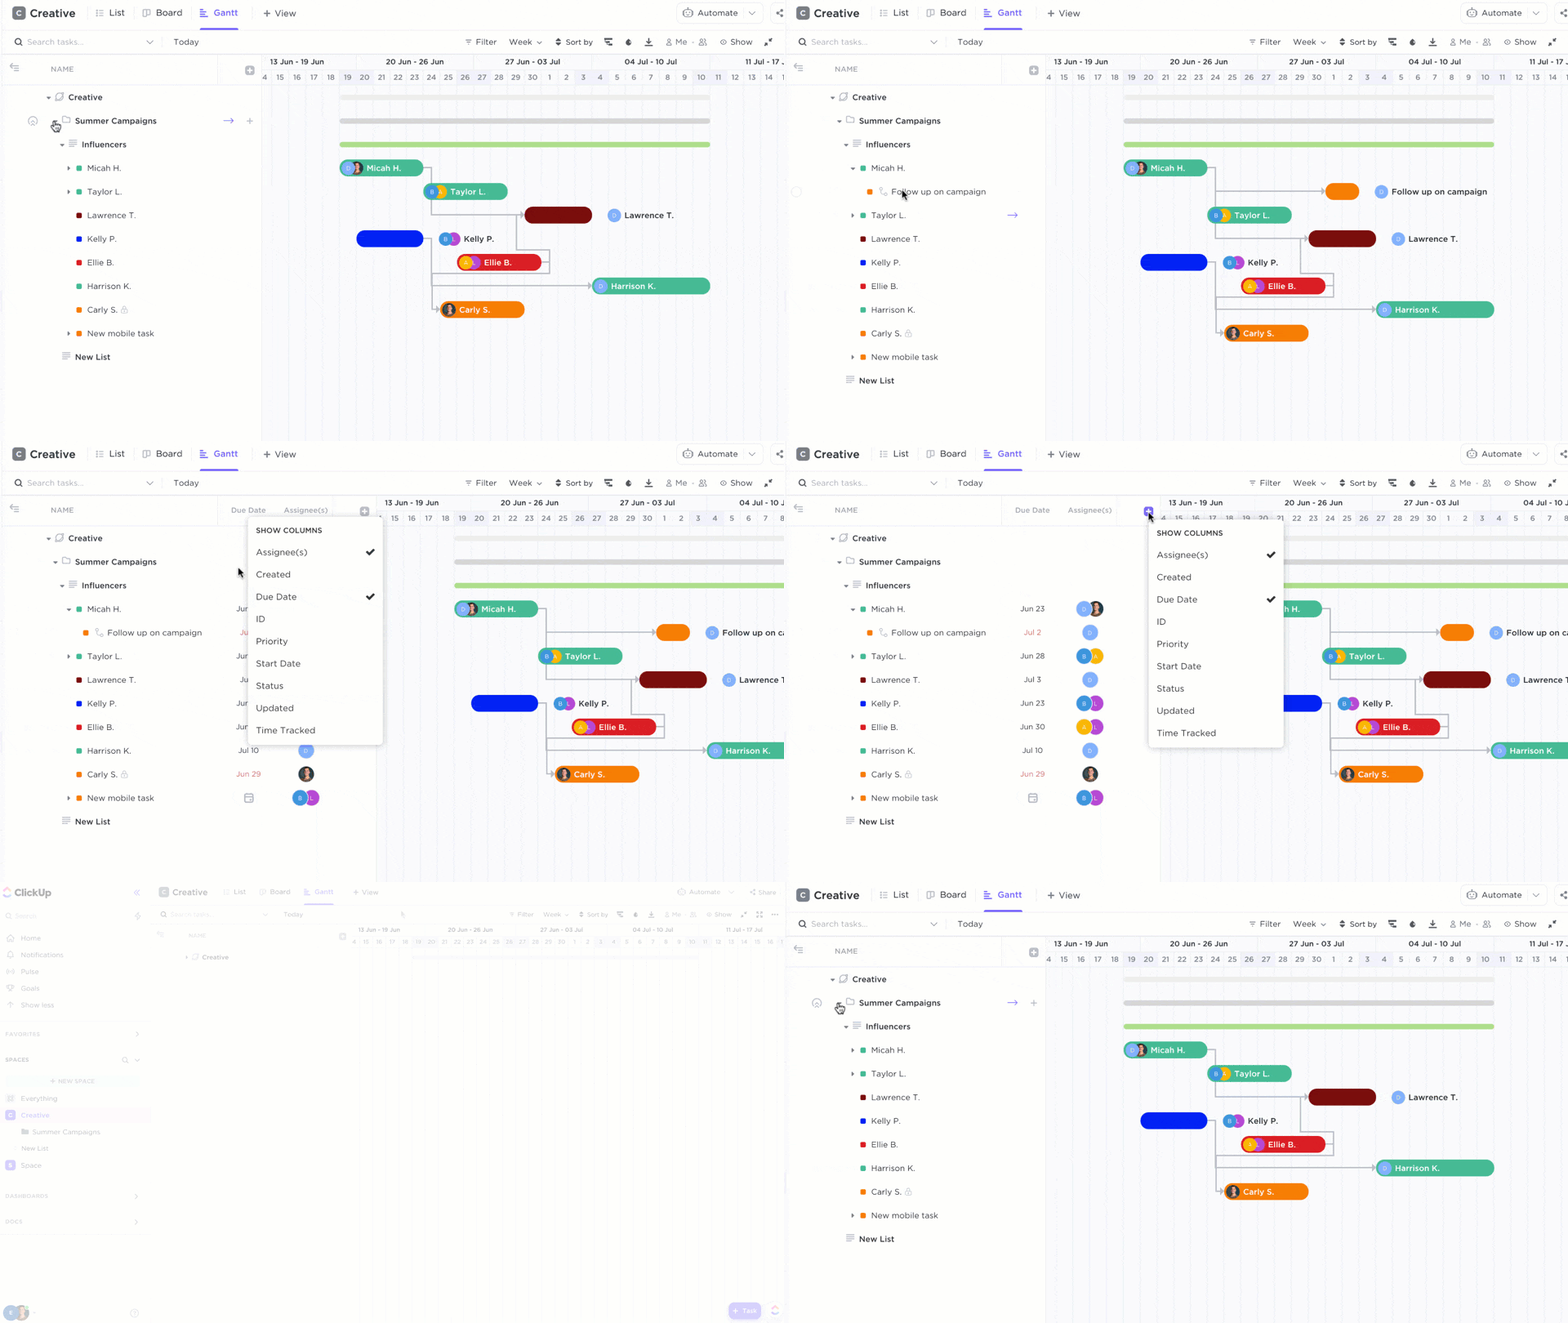
إظهار المزيد من العناصر مثل المكلفين وتواريخ الاستحقاق والمزيد في الشريط الجانبي لعرض جانت
ارتقِ بمخططاتك إلى أبعد من ذلك باستخدام ClickUp
علاوة على ذلك، يتكامل ClickUp مع أكثر من 1,000 أداة عمل أخرى وتأتي مجهزة بمجموعة كبيرة من مكتبة القوالب لكل حالة استخدام! بما في ذلك عدد لا يحصى من القوالب المعدة مسبقًا للوحات البيضاء والخرائط الذهنية وعرض مخطط جانت البياني لجعل عملك يتدفق بأكبر قدر ممكن من الكفاءة!
هل أنت مستعد لمعرفة مدى قوة مخططات سير العمل الخاصة بك؟ يمكنك الوصول إلى جميع هذه الميزات المتقدمة دون أي تكلفة على الإطلاق مع خطة مجانية للأبد عندما اشترك في ClickUp اليوم .

