لقد سمعنا جميعاً عبارة الجودة أكثر من الكمية، أليس كذلك؟
خلال فترة الدراسة الإعدادية، كانت هذه العبارة هي الشعار الذي يجب أن نعيش به، وحتى الآن، لا يزال هذا الشعور صحيحًا عندما يتعلق الأمر بالعديد من الأشياء في الحياة.
ولكن هذا هو بيت القصيد! نحن نعلم الآن أن الجودة والكمية عنصران ضروريان وثابتان في الحياة.
وسواء كانت معلوماتك نوعية أو كمية، فنحن بحاجة إلى النظر إلى هذه العناصر ككيانات منفصلة لفهمها بشكل صحيح. وهنا يأتي دور الرسوم البيانية والمخططات البيانية.
يتم تمثيل المعلومات العددية بأشياء مثل الأعمدة، أو الرسوم البيانية الخطية، أو المخططات الشريطية، أو - وهي المفضلة لدي شخصيًا - المخططات الفطائر.
في حين أن البيانات النوعية (المعلومات التي لا يتم تعريفها برقم واحد) يتم تمثيلها بشكل أفضل من خلال الرسوم البيانية مثل الخرائط الذهنية أو مخططات جانت .
كلاهما أساسيان لنجاح أي عمل تجاري سليم، ولكن في بعض الأحيان، يكون التوصل إلى المخططات الصحيحة لنقل المعلومات النوعية على أفضل وجه _صعبًا. لهذا السبب ستحب هذه المدونة.
اعتبر هذه المقالة دليلك الجديد لأهم 10 رسوم بيانية تحتاج إلى معرفتها لأي نوع من أنواع سير العمل، بما في ذلك وقت استخدامها، وأمثلة، وشهادات من واقع الحياة، وحيل لا بد من امتلاكها لإعدادها بسرعة.
10 أنواع من أمثلة المخططات البيانية لفريقك
قبل أن نمضي قدمًا هنا، دعنا نوضح شيئًا ما. _ما هي البيانات النوعية؟
البيانات النوعية هي أي معلومات لا يمكن التعبير عنها بقيمة عددية أو عدها. قد يشمل ذلك خطوات سير العمل، وأعضاء المؤسسة، والصور، والمفاهيم، والجداول الزمنية، وغير ذلك الكثير.
مثل البيانات الكمية، هناك طريقة صحيحة وأخرى خاطئة للتعبير عن البيانات النوعية اعتمادًا على ما تحاول القيام به معها. هذا هو السبب في أنه من المهم تحديد الغرض من معلوماتك قبل الالتزام بنوع معين من المخططات.
قد يبدو هذا طلبًا صعبًا، ولكن بالنسبة لجميع زملائي المتعلمين المرئيين هناك، سيكون الأمر أكثر منطقية عندما ترى أمثلة على أرض الواقع - وهو ما لدينا من أجلك!
لذا دون مزيد من اللغط، إليك 10 مخططاتنا المفضلة مع أمثلة.
_ملاحظة: نماذج مفيدة للغاية أمامك.
1. مخطط الخريطة الذهنية
إذا سبق لك استخدام برنامج مجاني لإدارة المشاريع مثل انقر فوق ربما تكون قد سمعت عن مخطط سير العمل الشهير هذا. الخرائط الذهنية هي أداة ممتازة أداة ممتازة للرسم التخطيطي وتخطيط سير العمل وتصور البيانات, العصف الذهني للعمليات الجديدة -والشعور بالإبداع أثناء القيام بذلك!
عادةً ما تبدأ هذه المخططات بفكرة رئيسية واحدة أو بهدف نهائي في الاعتبار لتتفرع منها، ويتشكل مخططك بشكل طبيعي من هناك. إنها مرئية للغاية، وأفضلها أيضًا مرنة وقابلة للتخصيص وتعاونية.
مثل شبكة الويب أو حتى تيار الوعي، تربط الخرائط الذهنية الأفكار (العقد) معًا لتنقل بصريًا كيف مرحلة المشروع تؤدي إلى المرحلة التالية.
إنشاء سير عمل لتقديم رؤية شاملة لعملية التوثيق الفني باستخدام الخرائط الذهنية ClickUp Mind Maps
وهذا ليس حتى أفضل جزء! يمكن أن تكون الخرائط الذهنية منظمة أو حرة كما يحلو لك. مع موارد مثل اللوحات البيضاء الرقمية ، يمكنك بناء خريطتك الذهنية كما تفعل في أي خربشة نهارية - إضافة الأشكال والموصلات والوسائط وحتى إدخال الفريق بأكمله في هذا المزيج.
متى تستخدم مخطط الخريطة الذهنية؟
في حين أن هذا المخطط شائع لتخطيط العمليات أو المشاريع التجارية الجديدة، تُستخدم الخرائط الذهنية أيضًا لأشياء مثل خرائط الشبكة التي تصف الأدوار المختلفة في الشركة، أو العصف الذهني للإجابات المحتملة على سؤال مركزي، أو استكشاف الموضوعات الفرعية لموضوع أكبر.
لا تنشغل كثيرًا بالقواعد هنا، فالخرائط الذهنية مصممة لتكون مخصصة. بالإضافة إلى ذلك، بمساعدة واحدة من العديد من قوالب الخرائط الذهنية المجانية والموارد المتاحة لك، لن تشعر أبدًا بالوحدة في عملية إنشاء أول خريطة ذهنية لك.
استخدم الخرائط الذهنية لتجسيد الخطط أو الاستراتيجيات للمهام في حياتك الشخصية _والمهنية بما في ذلك:
- نمو الأعمال
- الاستعراضات الأولية
- العصف الذهني
- العروض التقديمية للرسوم البيانية
- التهيئة
- خرائط الطريق
- إدارة الوقت
_والمزيد!
هل أنت مستعد لعمل خريطة ذهنية خاصة بك؟ ابدأ هنا بهذا قالب خريطة ذهنية بسيطة من ClickUp وشاهد سير عملك ينبض بالحياة. 💜
قم بتبسيط أفكار العصف الذهني باستخدام قالب الخريطة الذهنية البسيطة ClickUp
2. مخطط التسلسل الهرمي
مستخدم ClickUp حول العالم . نحن نحب المخططات التراتبية - إنها أساس منصتنا!
مثل الدمية الروسية المتداخلة، تبدأ المخططات الهرمية بموضوع واحد شامل (مثل مؤسستك بأكملها أو قسم كبير) وتصنف كل شيء تحت هذه المظلة من خلال تقسيمها إلى أجزاء متشابهة يمكن التحكم فيها.

يمنحك التسلسل الهرمي الفريد من نوعه في ClickUp المرونة في تنظيم الفرق من أي حجم
يمكننا التحدث عن نظام التسلسل الهرمي لأيام! اقرأ المزيد عن كيفية التسلسل الهرمي الفريد من نوعه في ClickUp مساعدتك في إنشاء البنية التحتية المثالية لتوسيع نطاق عملك.
متى تستخدم مخطط التسلسل الهرمي؟
المخططات الهرمية هي طريقة مرئية للغاية لتنظيم كل شيء - من المؤسسات إلى الأقسام والمشاريع المعقدة والمهام اليومية.
في حين أن المخططات التنظيمية تُظهر العلاقات بين الأشخاص في كل دور، فإن مخططات التسلسل الهرمي تُظهر كيف تتناسب كل مهمة أو مشروع يومي مع الصورة الكبيرة.
3. مخطط المصفوفة
من المؤكد أنك قد رأيت هذا النوع من المخططات من قبل - وربما استخدمت واحدًا لفهم موقف معقد أو قرار كبير!
مثالية لتصنيف عناصر متعددة، تتكون المخططات المصفوفية من أربعة أرباع عبر محورين. يمثل كل ربع ربع فئة مختلفة بينما يمثل كلا المحورين في بعض الأحيان موضوعين ثابتين متعارضين - أي مدى جودة أو ضعف أداء شيء ما، أو مدى حدوث شيء ما أو قلته، وما إلى ذلك. ومع ذلك، لا يجب بالضرورة أن يمثل المحوران أي شيء. في بعض الحالات، تعمل المحاور ببساطة كحدود لتقسيم البيانات بصرياً إلى أربع مناطق.
مثل الخرائط الذهنية, قوالب المصفوفة قابلة للتخصيص. يمكن تقسيم المعلومات إلى أرباع في شكل قائمة أو رسمها في نقاط محددة بالنسبة لما تمثله المحاور.
متى تستخدم مخطط المصفوفة؟
يمكن استخدام المخططات المصفوفية لأشياء في كل من المجالين الشخصي والمهني. قد يستخدم مديرو المشاريع هذا النوع من المخططات من أجل:
- تحديد النجاح المحتمل لمشروع جديد
- تحديد مجالات الحاجة في استراتيجية أعمالهم
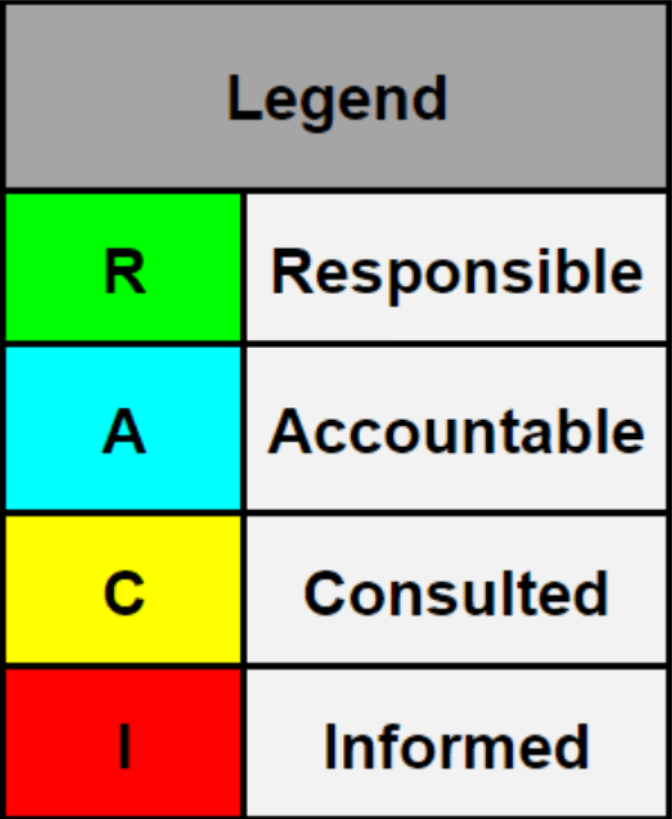
- تحديد أولويات الأفكار الجديدةمقارنة مشاريعهم> > والمشاركة التي تسمح للفريق ومدير المشروع بالبقاء منظمين. والغرض من مصفوفة RACI هو تقييم أصحاب المصلحة وتوثيق دور ومسؤولية كل شخص في مشروع معين > >> يجب أن تكون مصفوفات RACI بسيطة وسهلة الهضم؛ يجب أن يكون أي عضو في الفريق قادرًا على عرض المصفوفة وفهمها دون صعوبة. إن المساهم الرئيسي في مصفوفة RACI هو مدير المشروع وفريق المشروع، حيث أن أفضل استخدام لهذا المخطط هو أن يحاسب كل عضو من أعضاء الفريق الآخر على عمله بينما يعمل كمرجع لمديري المشروع من أجل > > / href/ > _https://clickup.com/blog/how-to-delegate// >تفويض العمل > /%href/ > > إلى الشخص الصحيح._
 كريستيان فيغيروا
، مدير مشروع في
المجلس الوطني لمجالس الولايات للتمريض (NCSBN)

مثال لمخطط المصفوفة بواسطة كريستيان فيغيروا لصالح NCSBN
4. مخطط الدائرة
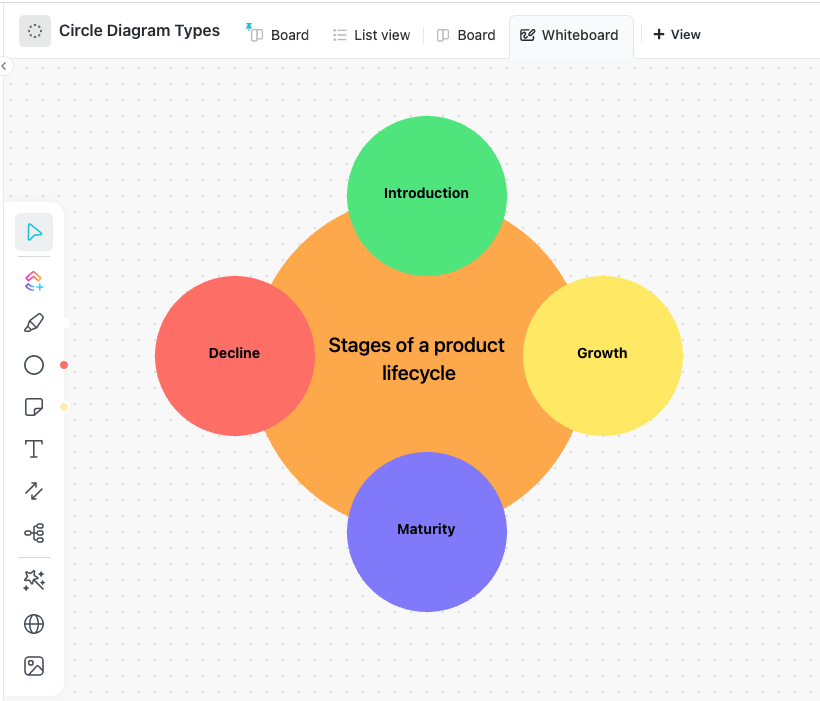
تقريبًا مثل النظير النوعي للمخطط الدائري الكلاسيكي، توضح المخططات الدائرية كيف تجتمع العناصر المختلفة معًا لإنشاء منتج أو فكرة واحدة كاملة. ولكن هنا تكمن المشكلة - بدلاً من نقل مقدار ما يمثله كل مكون من الدائرة (أو الفطيرة)، يتم تقسيم جميع أقسام المخطط الدائري بالتساوي.
يمكن إنشاء المخططات الدائرية باستخدام دائرة واحدة مقسمة على عدد معين من الفئات أو على شكل عدد من الدوائر مرتبة في دائرة. 🤯
يمكنك تخصيص مخطط الدائرة الخاص بك بألوان أو صور تتعلق بكل مكون. يمكنك أيضًا ترتيب كل جزء من مخطط الدائرة باستخدام دوائر متحدة المركز لنقل التسلسل الهرمي أو أهمية كل طبقة.
أضف الأشكال والنصوص والملاحظات وحتى تحويل العناصر الموجودة في مخطط الدائرة إلى مهام باستخدام ClickUp Whiteboards
متى تستخدم مخطط الدائرة؟
هذا النوع من المخططات متعدد الاستخدامات للغاية. سواء أكنت تعرض المدن المختلفة التي تشكل ولاية ما أو المراحل اللازمة لإكمال مشروع واحد، فإن المخططات الدائرية هي وسائل بصرية ممتازة في متناول اليد للاجتماعات مع أصحاب المصلحة في المشروع أثناء طرح أفكار جديدة، أو تقسيم عملية متعددة الخطوات.
المكافأة:%
_/مرجع/ https://clickup.com/blog/stakeholder-management-software// برنامج إدارة أصحاب المصلحة *%!_
متى تستخدم مخطط الهيكل التنظيمي؟
قد تشعر أن لديك فهمًا قويًا للهيكل التنظيمي الخاص بك بالفعل، ولكن من الجيد دائمًا أن يكون لديك المخطط التنظيمي في متناول اليد كمورد لزملائه أعضاء الفريق والموظفين الجدد والمستثمرين المحتملين وأصحاب المصلحة.
بالإضافة إلى ذلك، الشيء الوحيد الثابت في الحياة هو التغيير. غالبًا ما يكون وجود المخطط التنظيمي في متناول اليد هو الطريقة الأكثر فعالية لنقل التحديثات إلى سلسلة القيادة، وكيفية تأثير القرارات على المجموعة بأكملها، والتحركات الداخلية.
علاوة على ذلك، فإن وجود مخطط هيكلي محدث ويمكن الوصول إليه بسهولة هو وسيلة رائعة لتشجيع التواصل الداخلي.
قم بتمكين موظفيك من التعاون عبر الأقسام أو التواصل مع الموجهين المحتملين الذين ربما لم يلتقوا بهم أبدًا!
تحقق من هذه
_/مرجع/ https://clickup.com/blog/uml-diagram-software// أدوات مخطط UML %/%href/_
!
كشركة ناشئة، من المهم أن يكون الجميع في المؤسسة متناسقًا وأن تكون هناك أدوار واضحة للمسؤولية. لدينا مخطط تنظيمي ديناميكي لإظهار هياكل تقارير واضحة لجميع الموظفين في الشركة. ومع فهم الجميع لأدوارهم ومسؤولياتهم وهياكل الإبلاغ، نعمل معًا بشكل أكثر كفاءة، ونفهم توقعات بعضنا البعض، ونحقق الأهداف المشتركة مع التواصل بصدق وصراحة
 تشاد روبين
الرئيس التنفيذي ومؤسس شركة
بروفاسي
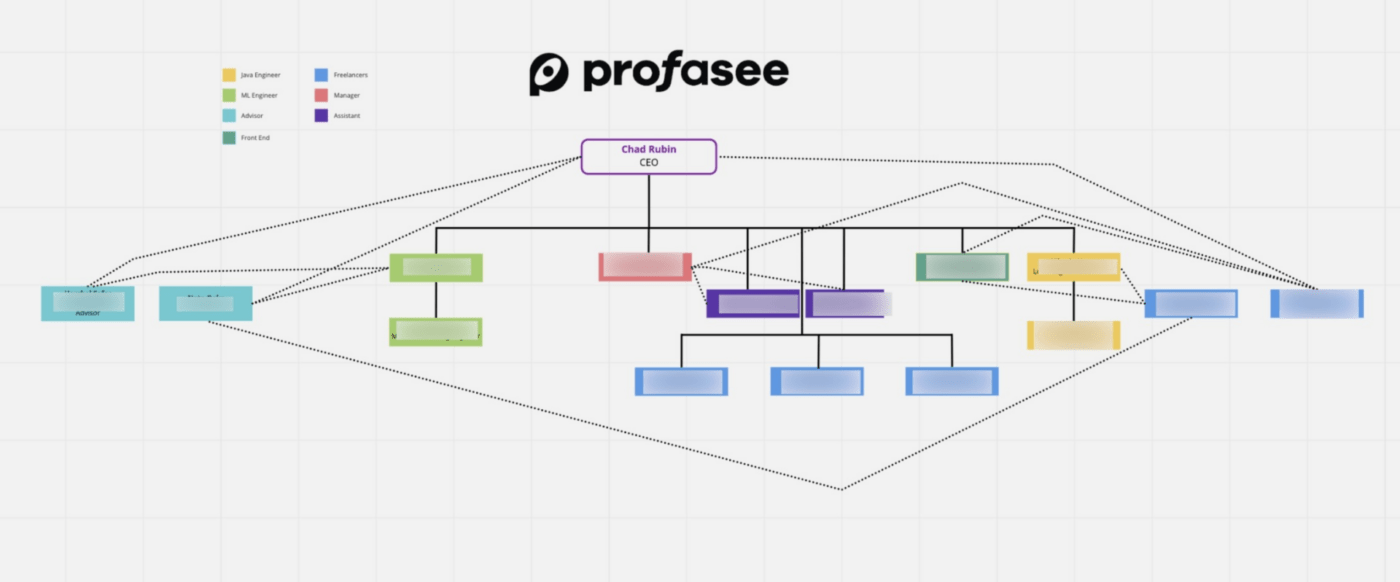
مثال لمخطط هيكلي تنظيمي من إعداد تشاد روبين في بروفاسي
7. مخطط جانت البياني
مفضل آخر من ClickUp. 💖
A مخطط جانت البياني يمثل الجدول الزمني للمشروع، مرتباً أفقياً على مخطط شريطي.
مثل مخطط المصفوفة، تقع مخططات جانت على محورين. يتصل المحور X مباشرةً بالجدول الزمني - الأيام أو الأسابيع أو الأشهر اللازمة لتغطية كامل المشروع. يضم المحور Y كل مهمة مطلوبة لإكمال المشروع، ويتم تمثيل كل مهمة على شكل شريط على مخططك الزمني.
من خلال تمديد كل شريط (مهمة) عبر الأيام أو الأسابيع اللازمة لإكمالها، يتشكل مخطط جانت الخاص بك. تمثل بداية كل شريط تاريخ بدء كل مهمة وتمثل نهاية الشريط الموعد النهائي لها.
قم بتجميع المهام أو تصفيتها أو إخفائها في مخططات جانت ClickUp 3.0 لتتبع سير العمل وربطها عبر جميع أعمالك
جزء من جمال مخططات جانت هو مقدار المعلومات التي يمكنك نقلها على شاشة واحدة. واعتماداً على برنامج إدارة المشروع الذي تستخدمه أو القالب الذي اخترته، يمكن لمخططات جانت أن تنقل بصرياً:
- علاقات المهام والتبعيات
- معالم المهمة
- مشاريع متعددة في وقت واحد
- تواريخ الاستحقاق المخططة مقابل الفعلية
- وغير ذلك الكثير 🤯
يبدو رائعاً جداً، أليس كذلك؟ إن مخططات جانت هي حلم كل مدير مشروع، ولدينا أفضل مخططات جانت دليل مخطط جانت البياني لتعرف بالضبط لماذا تحتاجها في حياتك.
متى تستخدم مخطط جانت البياني؟
مخططات جانت سهلة القراءة وسهلة الإعداد، مما يجعلها مثالية لأي حالة استخدام تقريبًا بما في ذلك مشاريع البناء والحملات التسويقية والتعليم والمهام اليومية والتخطيط للفعاليات وغيرها.
وبمساعدة قالب مرن ، لم يكن بدء مخطط جانت الخاص بك أسهل من أي وقت مضى! هذا القالب البسيط قالب مخطط جانت البياني من ClickUp هو نقطة البداية المثالية لأي شخص يرغب في الغوص في ينبوع مخططات جانت.
حدد العوائق في وقت مبكر واتخذ إجراءات فورية لإنجاز المشروع بسلاسة مع قالب مخطط جانت البسيط من ClickUp
8. مخطط سير العمل
يكمن جمال البيانات النوعية في أنه يمكن التعبير عنها بطرق عديدة ومختلفة! قد تلاحظ بالفعل بعض التشابه في أوجه التشابه بين أمثلة المخططات المختلفة في هذه القائمة، أو ترى كيف يمكنك استخدام نوعين من المخططات لتمثيل نفس مجموعة المعلومات.
العديد من هذه الرسوم البيانية مفيدة لتخطيط سير العمل إلى حد ما، ولكن مخططات سير العمل لها هدف نهائي أكثر تحديدًا وتتطلب بعض المعلومات غير القابلة للتفاوض.
تساعدك مخططات سير العمل على إدارة الوقت والمهام في الوصول إلى الهدف من خلال تقسيم الأمور إلى
- ما يجب القيام به
- ما هو قيد التنفيذ
- ما تم الانتهاء منه بالفعل
يمكن أن تأخذ هذه المخططات أشكالاً وأشكالاً عديدة اعتماداً على مدى تعقيد عملياتك الحالية، ولكن جميعها ستتبع منطقياً, تدفق المهام من البداية إلى النهاية تم تعيينها مقابل جدول زمني للتأكد من بقائك على المسار الصحيح.
بعض السمات الشائعة لـ تشتمل مخططات سير العمل على ألواح السباحة لتحديد المسؤول عن المهام والأسهم أو الروابط لإظهار علاقات المهام.
مكافأة:_%
_/مرجع/ https://clickup.com/blog/raci-matrix-examples// _أمثلة على المخطط البياني لـ_RACI *%&_
!
متى تستخدم مخطط سير العمل؟
تعتبر مخططات سير العمل شائعة في إدارة المشاريع، ولكنها يمكن أن تتحدث أيضًا عن أي عملية شخصية تقريبًا مثل يوم عملك، أو أهدافك الفصلية، أو التخطيط التعليمي، أو حتى تدريب كلبك الجديد.
من خلال رسم خريطة واضحة لكل مرحلة من مراحل المشروع أو الهدف، يمكنك المساعدة في منع الاختناقات قبل حدوثها، وتحسين التواصل بين فريقك، وزيادة الكفاءة، وزيادة ملكية الأشياء التي تنجزها. نحن نحب ذلك.
مكافأة:_ قوالب مخطط تقارب القوالب &
_href/ https://clickup.com/blog/affinity-diagram-tools// أدوات مخطط التقارب %/%href/_
!
عند إدارة برنامج تدريب جماعي أو مجموعة تدريبية، قد تشعر بأن جميع أجزاء إدارتك وتطوير المناهج الدراسية والتسليم ودعم الطلاب غير منظمة. وبصفتي مستشارًا لمؤسسي البرامج التعليمية والشهادات عبر الإنترنت، أجد أن إنشاء برامج متماسكة إدارة البرنامج ضرورية لتحقيق الكفاءة في إدارة التعليم عبر الإنترنت
في ClickUp، قمتُ بإنشاء مساحة أساسية ضمن سير عمل "التدريب الجماعي" مع العديد من المجلدات المنظمة بناءً على هذا الموضوع المحدد. باستخدام طريقة عرض التقويم للمساحة بأكملها وتنظيم القوائم والمجلدات حسب اللون داخل ClickUp، يمكنني تحديد الجلسات المباشرة القادمة التي يتم عقدها، ورسائل البريد الإلكتروني في أي حالة من الحالات، والمشاركات التي يتم جدولتها أو كتابتها لمجموعة المجتمع. إن سير العمل هذا هو الأكثر منطقية لتجارب التعلم الافتراضية، ولكن يمكن أيضًا تعديله لاستيعاب التدريب التعليمي الشخصي

ميلودي جونسون، مؤسس مستشار الدورة التدريبية
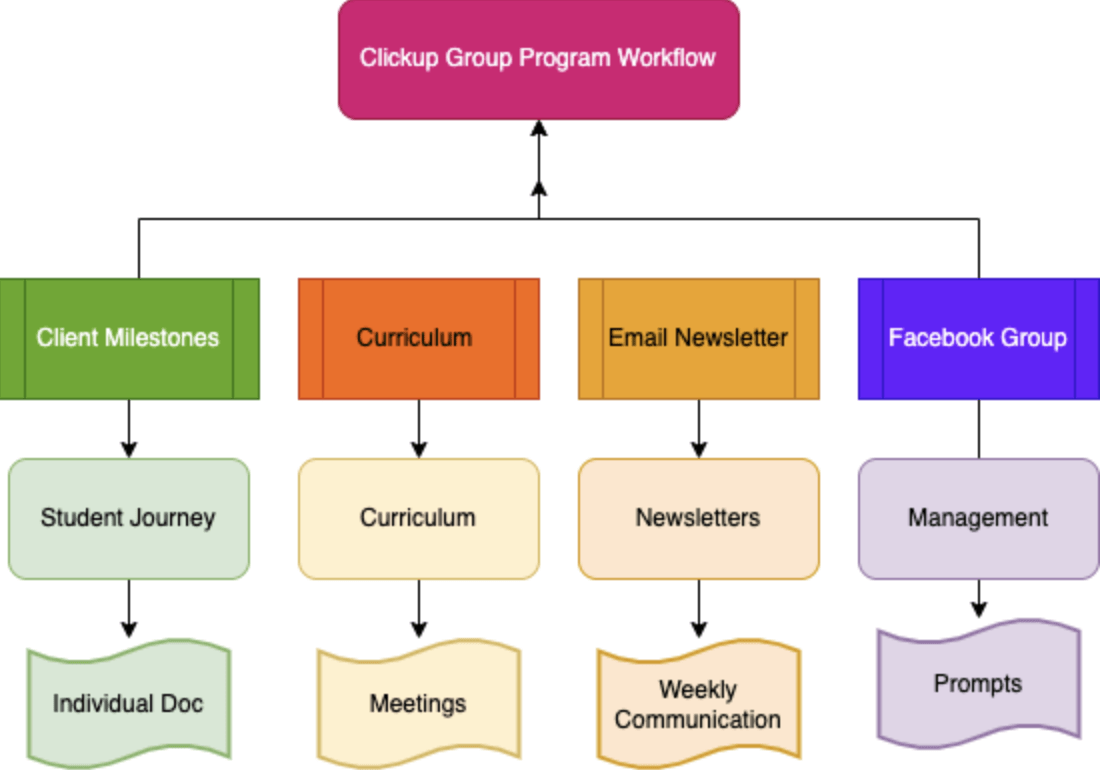
مثال لمخطط سير العمل الذي تم إنشاؤه في ClickUp بواسطة ميلودي جونسون في مستشار الدورة التدريبية
9. مخطط انسيابي مشابه لمخطط سير العمل,
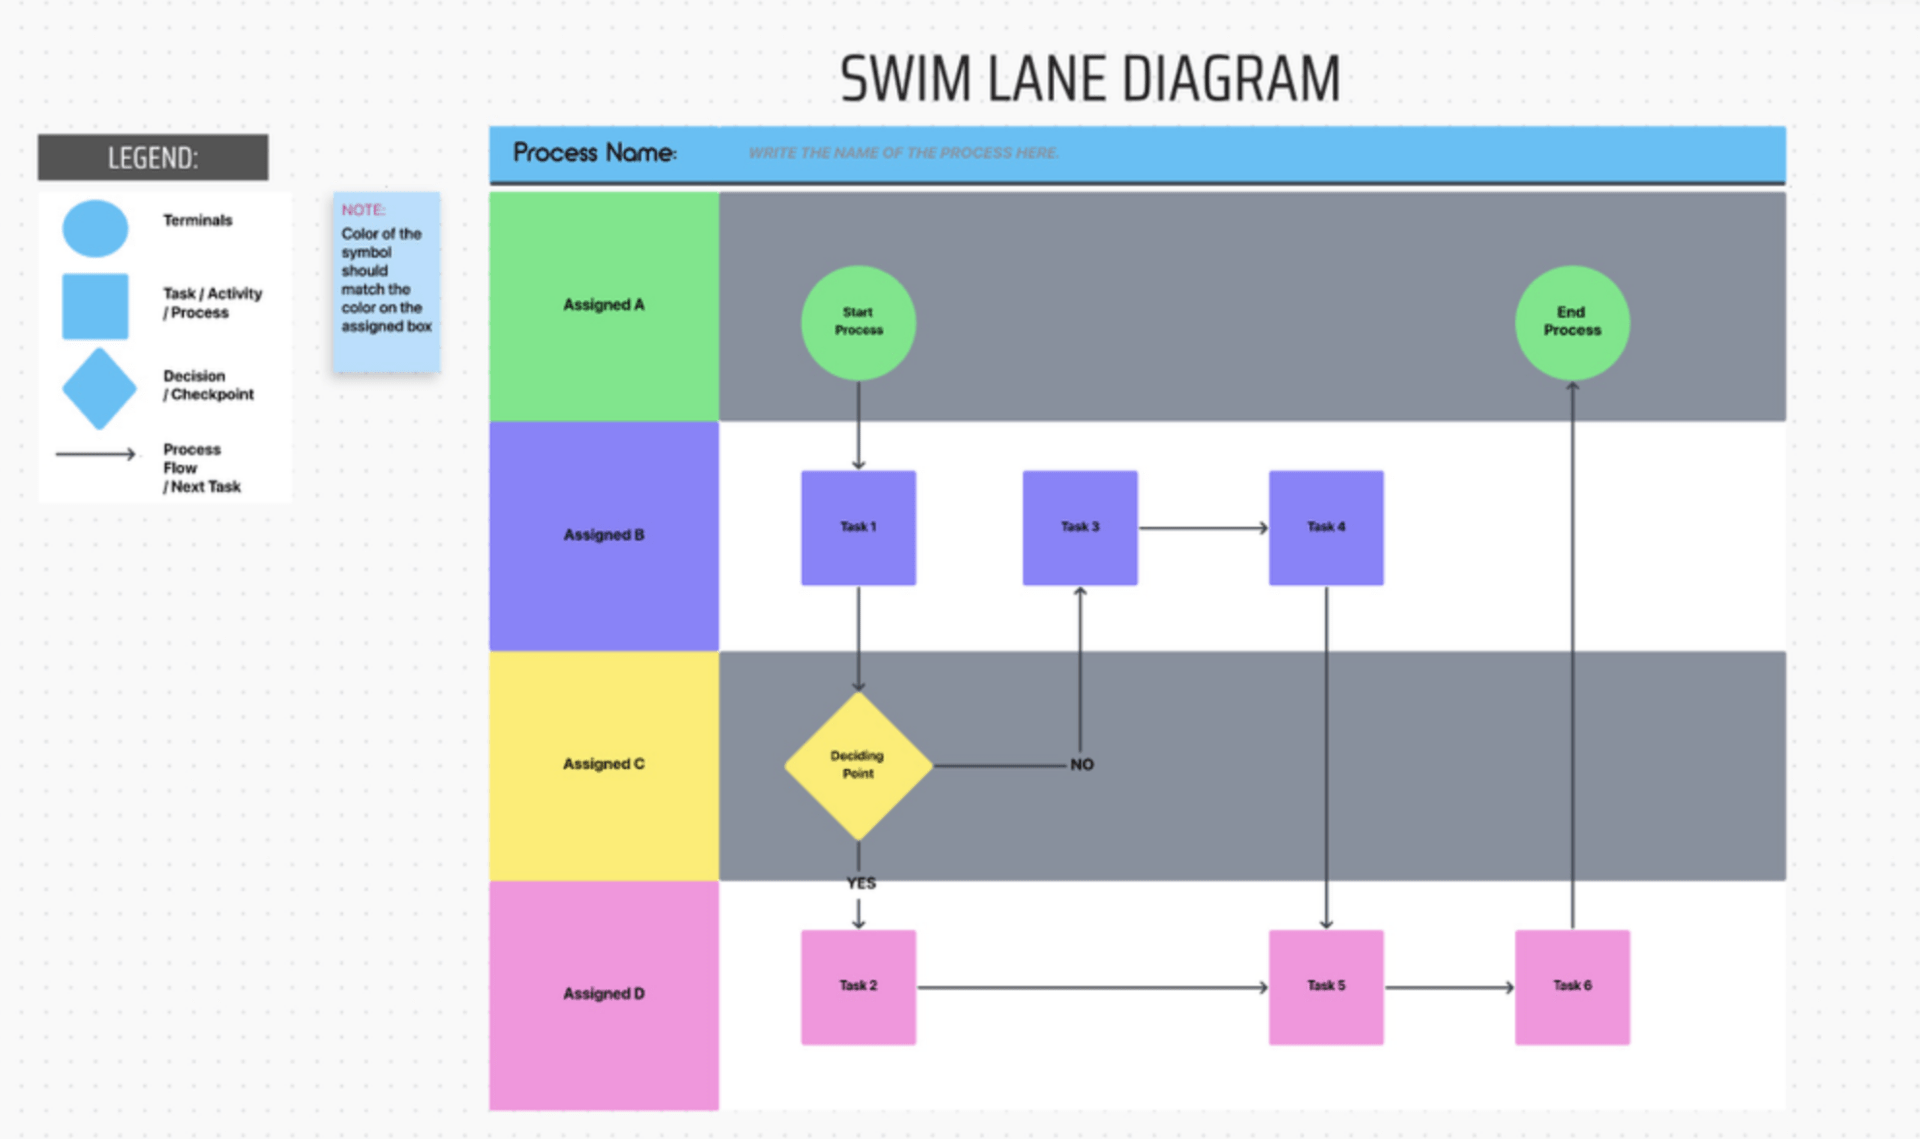
المخططات الانسيابية تصور المسار الذي ستسلكه في عملية معينة.
أولاً، حدد نقطة بداية ونهاية واضحة للمخطط الخاص بك، ثم استخدم الأشكال لتمثيل كل خطوة في العملية. اربط هذه الأشكال بخطوط وأسهم للتعبير عن ترتيب العمليات.
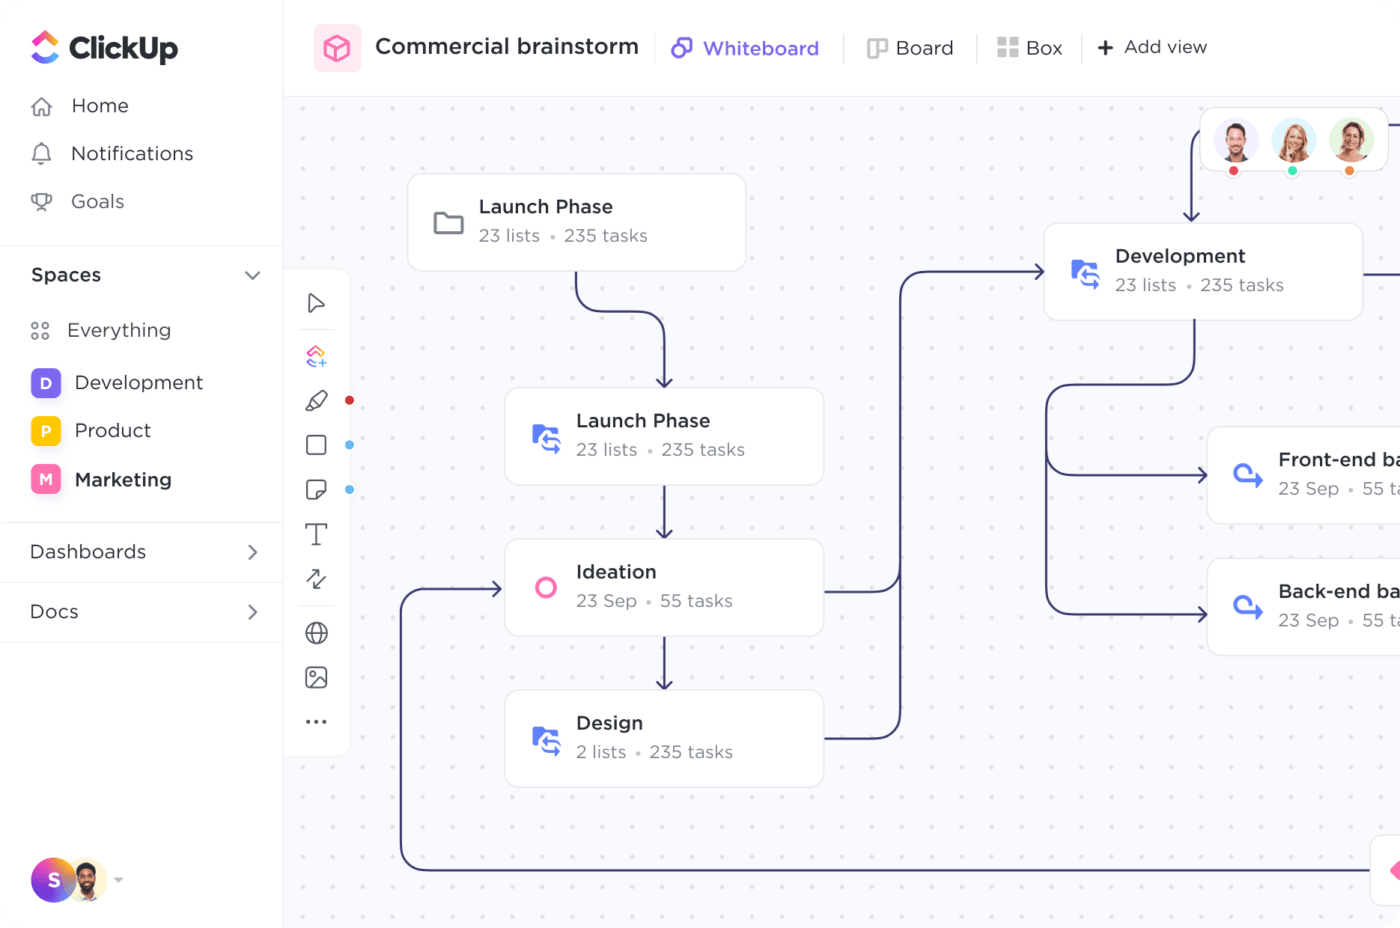
توفر لوحات ClickUp Whiteboards جميع الميزات الإبداعية والتعاونية التي تحتاجها لإنشاء المخططات الانسيابية التي تحلم بها
متى تستخدم المخطط الانسيابي؟
بينما تُستخدم المخططات الانسيابية عادةً لرسم سلسلة من الأحداث من البداية حتى النهاية، يمكنك أيضًا إضافة خيارات نعم أو لا إلى الأشكال الخاصة بك لإضافة عمليات إضافية إلى مخططك في حالة حدوث تغيير ما.
في وظائف الرعاية الصحية حيث تكون في مواجهة المريض، أو في دعم العملاء، أو في حل مشكلة، يمكن أن يكون هذا مفيدًا جدًا!
بالنسبة لمديري المشاريع، تُعد المخططات الانسيابية نقطة انطلاق ممتازة لقياس الوقت والموارد والخطوات التي ينطوي عليها إكمال المشاريع الجديدة.
استخدم قالب المخطط الانسيابي لمسار السباحة الخاص ب ClickUp لمشروعك القادم!
حقق أقصى استفادة من سير عملك باستخدام اللوحات البيضاء باستخدام قالب المخطط الانسيابي لمخطط سويملاين من ClickUp
10. مخطط مخطط بيرت PERT
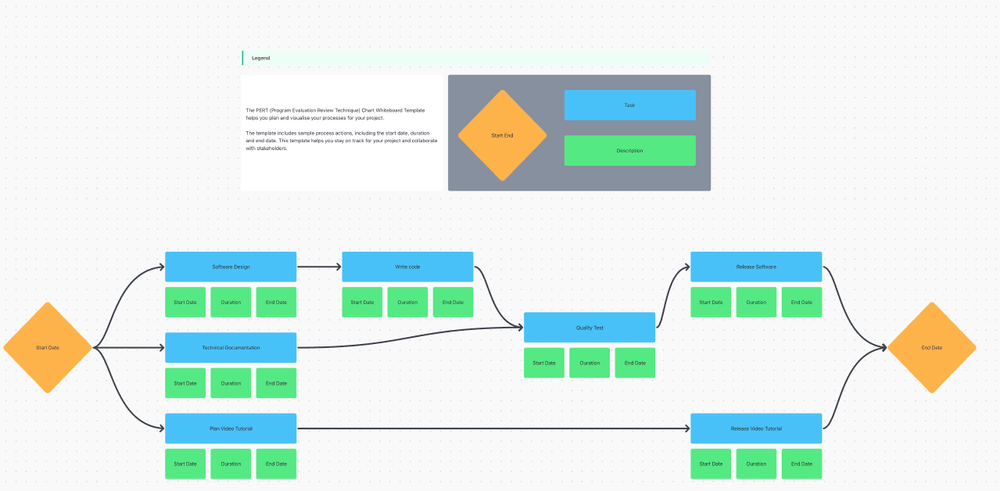
آخر القائمة مخططات بيرت البيانية والتي تشبه الخرائط الذهنية التي تركز في المقام الأول على معالم المشروع التي تشكل المسار الحرج .
مثل المخططات الانسيابية, مخططات بيرت تربط الأشكال (المهام) بأسهم لنقل تدفق الأحداث في المشروع - ولكنها تستخدم لتحديد علاقات المهام أكثر من تقديم تحديثات حول عملية المشروع.
ولكن مع برنامج إدارة المشروع الصحيح، يمكنك أن تأخذ مخططات بيرت PERT إلى أبعد الحدود! وهي اختصار لتقنية مراجعة تقييم البرنامج، يمكن أن تساعدك مخططات بيرت على تصور مسارات متعددة للإنجاز وتحديد أولويات مهامك الأكثر أهمية.
أحد عيوب مخططات بيرت هو أن إعدادها وتعديلها وتحديثها قد يستغرق وقتًا طويلاً. لحسن الحظ، فإن نموذجًا بديهيًا وديناميكيًا مثل هذا قالب مخطط بيرت من ClickUp لمعالجة هذا التحدي بالضبط.
يساعدك قالب مخطط بيرت البياني من ClickUp على إنشاء جدول زمني مرئي مفصل لمشروعك، حتى تتمكن من البقاء على المسار الصحيح والتأكد من عدم إغفال أي تفاصيل.
متى تستخدم مخطط بيرت البياني PERT؟
مخططات بيرت هي لمحة عالية المستوى للمشروع. هذه المخططات مفيدة للرجوع إليها عند التخطيط لمشروعك المعالم الرئيسية أو وضع مسارك الحرج. بالإضافة إلى ذلك، يمكن لمخططات بيرت أن تعطيك فكرة عن المدة التي قد تستغرقها كل مهمة، خاصةً إذا لم تكن متجهاً إلى مشروعك مع تقدير واضح للوقت في ذهنك بالفعل.
مكافأة:
/مرجع/ https://clickup.com/blog/draw-io-alternatives//** بدائل Draw.io //%href/
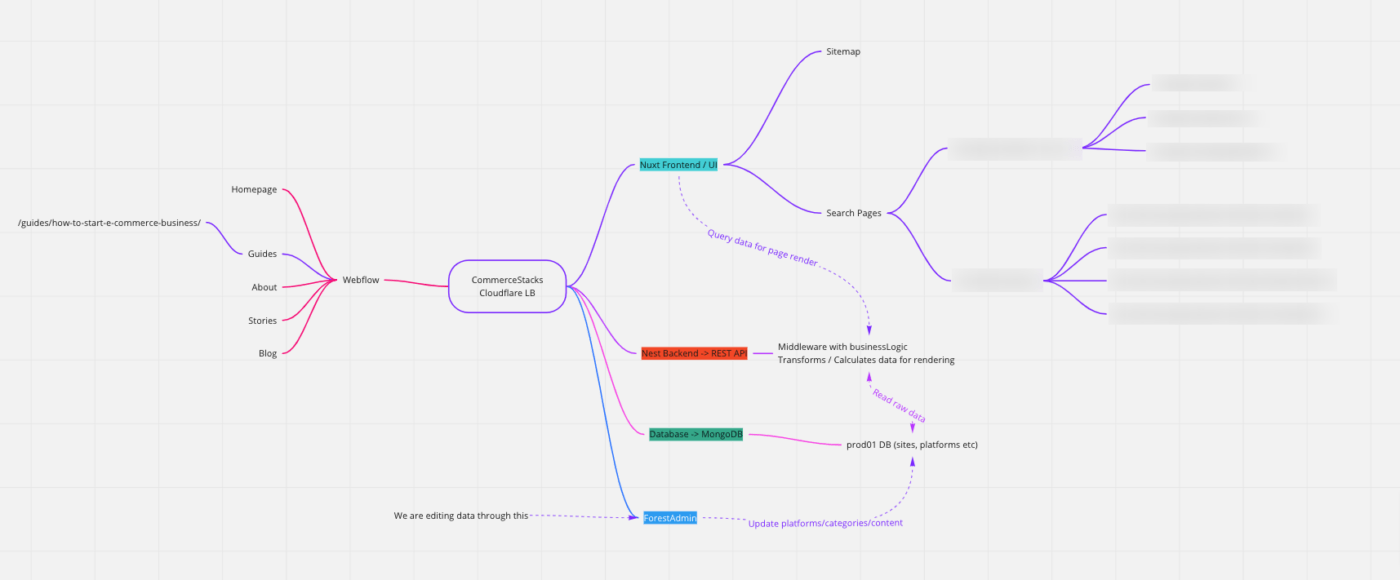
لقد استخدمنا مخطط بيرت عند إنشاء تطبيق الويب الخاص بنا لأعمالنا. أنا لست مهندسًا، لكن شريكي المؤسس مهندس، لذا كان من الضروري بالنسبة له بناء مخطط يوضح تدفق أنظمتنا وكيفية اعتمادها/اعتمادها على بعضها البعض
_ هذا يسمح لي بتصور تدفق البيانات وعرض التطبيق والجدول الزمني لتدفق البيانات عبر أنظمتنا المختلفة. وباستخدام هذا المخطط، يمكن لشريكي المؤسس أن يوضح بسهولة أين تنشأ المشاكل في تطبيقنا حاليًا ومشاركتها مع الأفراد الآخرين ومعي في فريقنا
مثال على مخطط بيرت البياني بواسطة نيك كوتر في جروان
إنشاء مخططات بيانية باستخدام ClickUp
حسنًا، كان هذا الكثير من الرسوم البيانية - وفي مرحلة ما، ربما ستحتاج إلى استخدامها جميعًا! ولكن هناك ضوء في نهاية هذا النفق المليء بالعمل لأن لديك انقر فوق . 😊
ClickUp هو منصة الإنتاجية الشاملة والمثالية لإدارة المشاريع وإنشاء مخططات جميلة والعمل مع الفريق دون الحاجة إلى فتح علامة تبويب أخرى. من بين قائمة ClickUp المتزايدة باستمرار من الميزات القابلة للتخصيص بالكامل، هناك خرائط ذهنية مدمجة وأدوات جانت وأدوات السبورة الرقمية - ماذا يمكن أن تطلب أكثر من ذلك؟
سنوضح لك كيفية عملها. 🤓
عرض جانت في ClickUp
تم تصميم ClickUp لتحسين عملياتك وتوفير الوقت، بغض النظر عن حجم فريقك أو مجال عملك. عادةً ما يكون هناك الكثير من العمل الذي يستغرقه إنشاء مخطط جانت ببساطة وتحديثه يدويًا للتأكد من أنه يظل مفيدًا لك! لكن الأمر ليس كذلك في ClickUp. 👏 عرض جانت في ClickUp متصل مباشرةً بسير عملك ويتم تحديثه تلقائيًا ليعكس أي تقدم تحرزه.
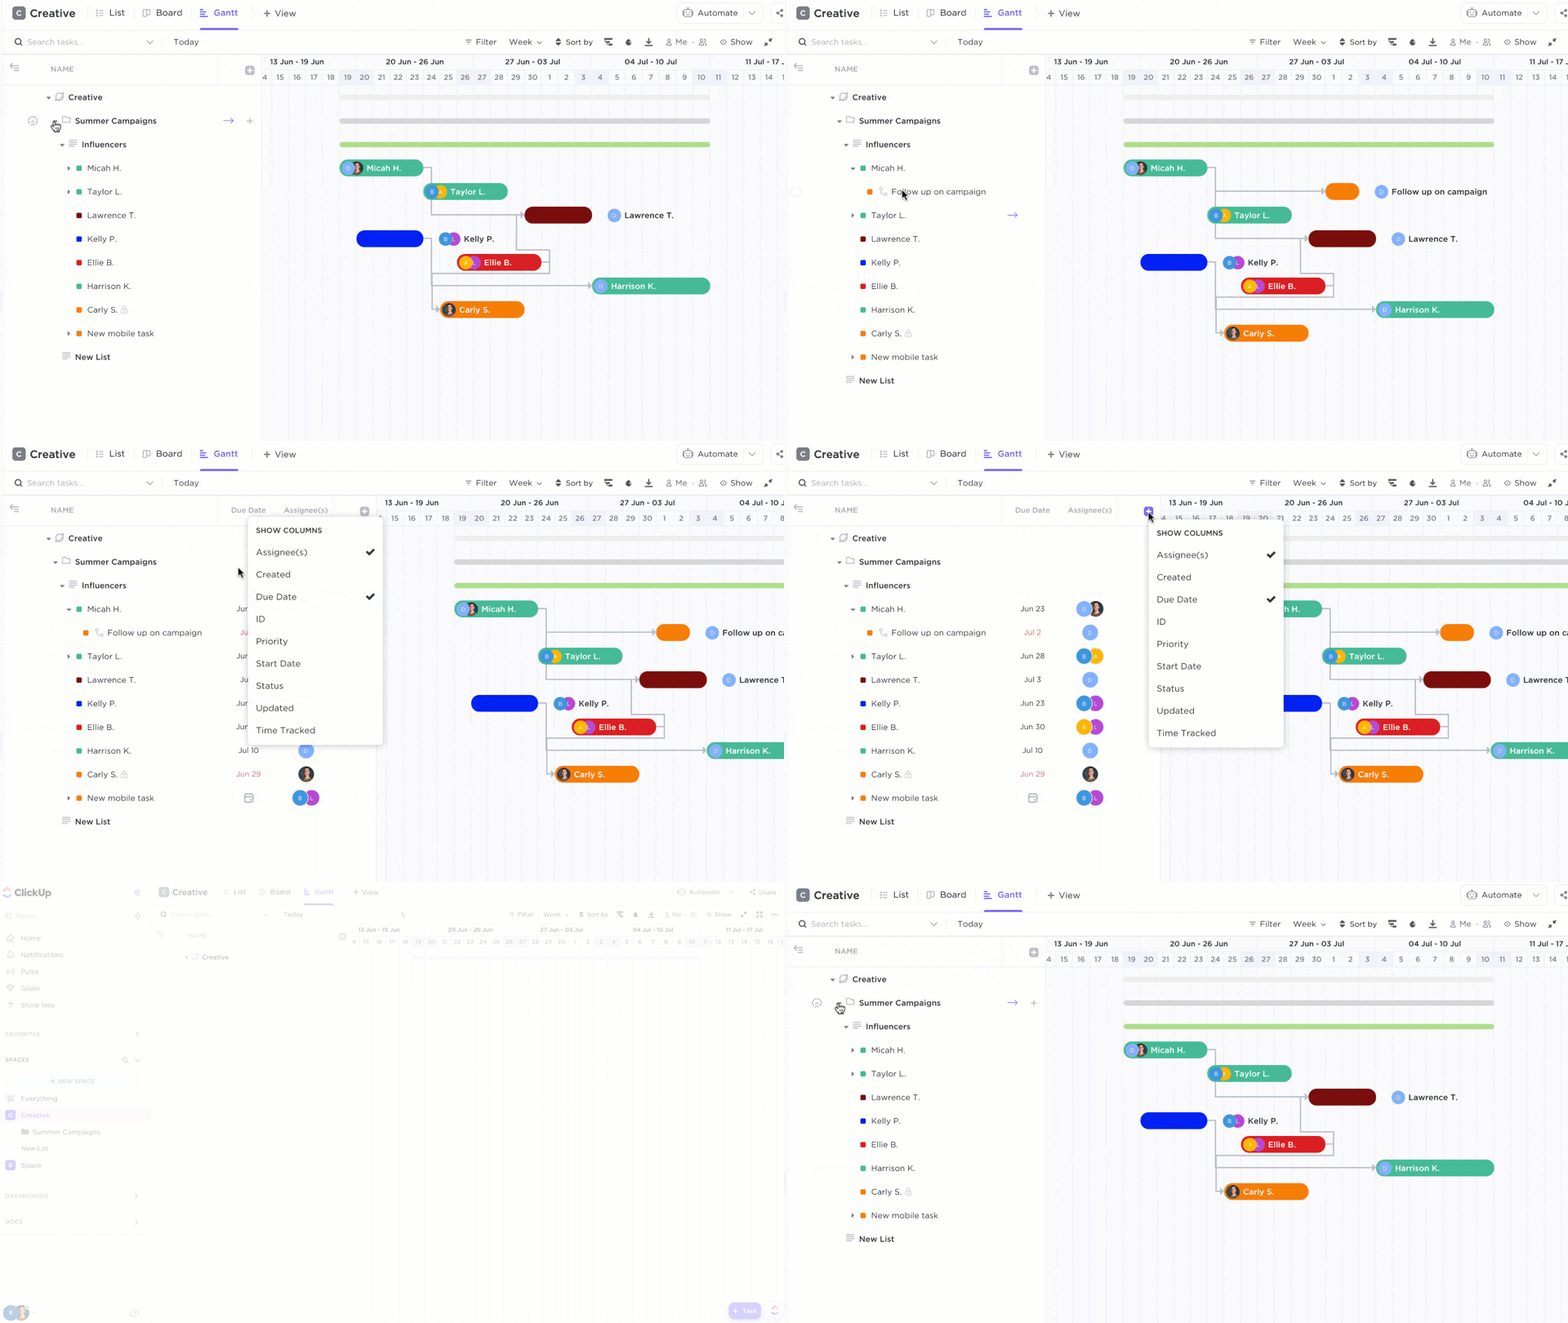
إظهار المزيد من العناصر مثل المكلفين وتواريخ الاستحقاق والمزيد في الشريط الجانبي لعرض جانت
سيتشكل مخططك الزمني بشكل طبيعي عندما تضيف المهام والمواعيد النهائية وتواريخ البدء إلى مشروعك.
انقر فوق الخرائط الذهنية الخرائط الذهنية ClickUp مثالية لإنشاء المخططات الشبكية التي تحدد تطور مشروعك. كما أن الخرائط الذهنية مثالية أيضًا للمخططات التنظيمية والمخططات الانسيابية ومخططات بيرت ومخططات سير العمل وغير ذلك الكثير - فهي متعددة الاستخدامات!
قم بتخطيط وتنظيم الأفكار والمهام وسير العمل والمزيد بصريًا باستخدام وظيفة السحب والإفلات البديهية في ClickUp. ثم اسحب الفروع لإظهار علاقات المهام والتبعيات، أو اضبط مواقع العقد لتنظيم مساحة عملك وإعادة ترتيبها.
وإذا كنت لا تريد أن تكون خريطتك الذهنية _كلها حول المهام، فجرب الوضع الفارغ! لن تكون العُقد مرتبطة بأي بنية مهام محددة حتى تتمكن من الإبداع كما يحلو لك. ❤️🔥

تخصيص خريطتك الذهنية من البداية في ClickUp باستخدام الوضع الفارغ
لوحة الخرائط الذهنية في ClickUp برنامج السبورة الرقمية هو الأكثر انتشارًا في الوقت الحالي، ولكن هل تعلم أن ClickUp هو أحد المنصات القليلة التي تبني ميزة السبورة البيضاء الخاصة بنا داخليًا، من الصفر؟ 🍪
ClickUp السبورة البيضاء توفر لوحة لا متناهية لرسم المخططات والرسوم البيانية من أي نوع - حتى الخرائط الذهنية والمصفوفة ومخططات SWOT والرسوم البيانية الدائرية وكل شيء آخر تقريبًا. ناهيك عن أن ClickUp تقدم الكثير من قوالب الرسوم البيانية خصيصًا للوحات البيضاء التعاونية لمساعدتك في توفير الوقت وانطلق في أسرع وقت ممكن.
أضف الأشكال التي تتحول مباشرةً إلى مهام ClickUp وترتبط بسير عملك، ثم ارسم الروابط بينها لإظهار ترتيب المهام بسهولة.

قم بتحويل الأشكال إلى مهام على لوحة ClickUp Whiteboard لبدء وضع المخطط الانسيابي الخاص بك موضع التنفيذ على الفور
بغض النظر عن مستوى خبرتك، أو مدى راحتك في الإبداع، أو نوع الرسم التخطيطي الذي تريده، ستكون سبورة ClickUp Whiteboards لعبتك المفضلة الجديدة.
وهل ذكرنا أن جميع هذه الميزات هي مجانية بالكامل ?_
ابدأ في جعل عملية التخطيط أسهل وأكثر بصرية وبديهية مع الخرائط الذهنية وعرض جانت واللوحات البيضاء في ClickUp! 📈
