سواء كان عملاً مكتبياً أو خططاً صغيرة أو مشاريع كبيرة - يتكون عبء العمل اليومي عادةً من عدة مهام صغيرة. ولكن قبل أن تنتقل المهمة إلى مرحلة أخرى، يجب أن تنتهي من تبعيتها الحالية. بالنسبة لمديري المشاريع وقادة الفرق، من الضروري أن ترى كيف تتحرك المهمة خلال كل مرحلة وترتبط بالمهام الأخرى في سير عملك حتى تتمكن من توقع معوقاتها.
يكمن التحدي هنا في أن العديد من الأشخاص يعتمدون على جداول البيانات لإظهار وتتبع وعرض تبعيات المشروع - ولكن إذا كنت تحاول إظهار التبعيات في Excel, يصبح الأمر صعبًا بعض الشيء.
إن معرفة تبعيات المهام في أي مشروع أمر حيوي - وهذا يعني أن تسلسل سلسلة من المهام لا يمكن أن يتغير، وأنه لا يمكن البدء في مهمة معينة حتى تكتمل مهمة أخرى، والعكس صحيح. يستخدم مديرو المشاريع عادةً برنامج إدارة المهام لتتبع التبعيات بين مهام المشروع الفردية.
باختصار، تبعية المهام، في هذه الحالة، هي العلاقة البسيطة بين مهمتين أو أكثر في المشروع. تعد تبعيات المهام شائعة في Excel للمساعدة في تحديد الترتيب الذي تنفذ به الفرق المشاريع.
هناك طرق مختلفة تستغرق وقتًا طويلاً نسبيًا لإظهار التبعيات في Excel. وعلى الرغم من وجود طرق أخرى سهلة الاستخدام لإظهار التبعيات، إلا أننا سنركز على كيفية القيام بذلك في مخططات جانت في Excel أولاً، ثم توفير طريقة أسرع للحصول على نفس العرض (وأكثر تفصيلاً) من خلال أداة مختلفة.
ما هي التبعيات في Excel؟
التبعيات هي الأنشطة أو المهام التي تعتمد عليها مهام أخرى - أو تعتمد على مهام أخرى لإكمالها أولاً. باختصار، التبعيات في Excel هي علاقة بسيطة بين مهمتين أو أكثر من المهام المعلقة في المشروع.
تُعرف تبعية المهام أيضًا بالعلاقة المنطقية، والتي يمكن أن تكون تبعية بين مهام المشروع أو بين المهام والمعالم الرئيسية .
تتطلب إدارة المشروع فهمًا صحيحًا لتبعية المهام وكيفية إظهار تلك التبعيات في Excel. ومن حسن حظك أننا سنتعمق في هذه العملية لمساعدتك في إنشاء وفهم تبعيات المهام الخاصة بك باستخدام هذه الأداة. 🤓
كيفية إظهار تبعيات المهام في Excel
بغض النظر عن مدى روعة الجدول الزمني للمشروع، فإن الفشل في تضمين وصف للتبعيات الحرجة المرتبطة بالمشروع يشكل خطرًا كبيرًا على تقديم قيمة المشروع من الدرجة الأولى. 🚩
يعد إنشاء المهام التابعة في Excel أمرًا سهلاً مثل النقر المزدوج على مهمة ما وتعيين التبعيات من الجزء الأيمن - ولكن دعنا نتعرف على ذلك معًا. إليك دليل تفصيلي خطوة بخطوة لإظهار تبعيات المهام في Excel:
الخطوة 1: افتح علامة التبويب تحرير المهمة
انقر بزر الماوس الأيمن على المهمة التي ستستخدمها كسلف، وستظهر علامة التبويب تحرير المهمة.
الخطوة 2: حدد المهمة السابقة من القائمة المنسدلة
اختر المهمة السابقة التي ترغب في استخدامها.
الخطوة 3: قم بتعيين نوع التبعية والتأخر
هناك أنواع مختلفة من التبعيات المتاحة في مخطط جانت إكسيل وهي
- من النهاية إلى البداية
- من البداية إلى البداية
- من النهاية إلى النهاية
- من البداية إلى النهاية
في حين أن أيًا من هذه التبعيات قد تحدث في مشروعك، إلا أن التبعية من النهاية إلى البداية هي أكثر أنواع التبعيات شيوعًا ومنطقية في إدارة المشروع اليومية.
الخطوة 4: إضافة التبعية
انقر على إضافة لإضافة التبعية، ثم انقر على موافق.
ثم يتم تعيين تبعية المهمة على الفور داخل المخطط الزمني.
الخطوة 5: إظهار الروابط
في حالة عدم ظهور موصلات تبعية المهام، توجه إلى إعدادات ضمن قائمة جانت، ثم انقر على إظهار الروابط.
كيفية تحرير تبعية مهمة في Excel
نحن نتفهم ذلك، فالأخطاء تحدث والظروف تتغير! لا شيء ثابت في Excel أيضًا. هناك دائمًا تغيير تبعيات مهامك إذا لزم الأمر. إليك حيل التحرير السريعة:
- لتغيير تبعية مهمة في Excel، انقر نقرًا مزدوجًا على المهمة المقصودة
- لحذف تبعية، اختر تبعية مهمة وانقر فوق الزر حذف
- لتعديل تبعية، انقر فوق الزر تعديل
تذكر أن تضغط على حفظ مرة واحدة وتنتهي!
أنواع تبعيات إكسل
هناك نوعان شائعان من تبعيات Excel التي سنتطرق إليها وتبعيات المهام المحددة المختلفة التي تندرج تحت كل نوع منها:
1. تبعيات التتبع
تُعرَّف تابع الأثر بأنها الخلية - أو مجموعة الخلايا - التي تتأثر بعنصر آخر قمت بتحديده. يعرض Excel الأسهم الزرقاء التي تربط الخلايا الأخرى المرتبطة بالخلية النشطة عند استخدام أداة تدقيق الصيغة.
عادةً ما تحتوي جداول بيانات Excel على العديد من الصيغ، وسيكون فهم العلاقة بين الخلايا في جدول البيانات أمرًا صعبًا بدون تتبع التابعين أو ميزات تتبع التابعين أو مخططات جانت في Excel .
باختصار، تابع التتبع هو أداة مدمجة لتدقيق الصيغ في Excel تساعد المسؤولين وفرق العمل على تحليل العلاقات بين الخلايا في ورقة عمل Excel.
2. تبعيات مخطط جانت البياني
A تبعية مخطط جانت البياني والمعروف أيضًا باسم المهمة التابعة، يشير ببساطة إلى العلاقات بين المشاريع.
تحتوي معظم المشاريع على مهام متعددة تحدث في تتابع سريع أو في وقت واحد وغالبًا ما تؤثر هذه المهام على بعضها البعض ويشار إليها باسم تبعيات مخطط جانت. إدارة مشروع مخطط جانت البياني مثالية لإنشاء العديد من المهام وتتبعها، وفهم كيفية ارتباطها ببعضها البعض. يتم نقل علاقات المهام المختلفة بصريًا في مخططات جانت، مما يسهل إدارة الإجراءات المتعددة التي تحدث جنبًا إلى جنب.
يتم تعريف علاقات المهام المختلفة على أنها مختلفة أنواع مخطط جانت التبعيات، إليك بعضًا من أكثرها شيوعًا:
تبعية المهام من الانتهاء إلى البدء
تعد تبعية المهمة من الانتهاء إلى البدء أكثر أنواع تبعية مهام جانت شيوعًا وهي أيضًا سهلة الفهم. تحدث تبعية المهمة هذه عندما يجب إكمال المهمة الأولى لبدء المهمة اللاحقة. لذلك، فإن إكمال المهمة الرئيسية الأولى متأخرًا عن الجدول الزمني يعني أن المهمة اللاحقة ستبدأ أيضًا متأخرة عن الجدول الزمني، مما يؤدي إلى تأثير الدومينو. 😳
تبعية المهمة من البداية إلى البداية
تحدث هذه التبعية عندما لا يمكن أن تبدأ مهمة ثانوية حتى تبدأ المهمة الأولية.
ملاحظة: لا يجب أن تحدث المهمتان بشكل متعاقب أو أن تبدآ في وقت واحد (وغالبًا لا يحدث ذلك). يمكن أن تبدأ المهمة الثانوية بعد بدء المهمة الأولية بوقت كافٍ - بشرط أن تكون المهمة الأولية قد بدأت.
في معظم الحالات، قد تنتهي المهمة الأولى قبل بدء المهمة الثانية بفترة طويلة. ومع ذلك، بما أن المهمة الأولية لا يجب أن تنتهي قبل أن تبدأ المهمة الثانوية، فهذا ليس تبعية إنهاء لبدء.
تبعية المهمة من البدء إلى الانتهاء
على الرغم من ندرتها الشديدة، إلا أن التبعيات من البداية إلى النهاية لا تزال تحدث من وقت لآخر.
هذه التبعية هي ببساطة عكس التبعية النموذجية من البداية إلى النهاية، حيث يجب أن تكتمل المهمة الأولى حتى تبدأ المهمة الثانوية. مع تبعية البدء إلى الانتهاء، لا يمكن إكمال المهمة الأولى حتى تبدأ المهمة الثانوية. على هذا النحو، لا يجب أن تنتهي المهمة الثانوية في نفس الوقت الذي تبدأ فيه المهمة الأولية.
تبعية المهمة من الإنهاء إلى الإنهاء
تشير هذه التبعية إلى الحالة التي يجب أن تكون فيها المهمة الأولى منتهية لكي تكون المهمة اللاحقة منتهية أيضًا. ترتبط المهمتان الأولى والثانية ارتباطًا مباشرًا ويمكن أن تحدثا في وقت واحد.
ملاحظة: تتوقف المهمة الثانية بشكل كامل على المهمة الأولى ولا يجب أن تكتمل في نفس الوقت الذي تكتمل فيه المهمة الأولى.
عيوب استخدام برنامج Excel لإظهار التبعيات
على الرغم من فوائده وشعبيته العالمية بين الشركات، إلا أن Excel ليس الأداة الأفضل لإظهار تبعيات المهام بسرعة أو سهولة - خاصة بالنسبة للأنظمة التي تعتمد على البيانات.
إليك بعض الأسباب الرئيسية وراء ذلك:
قابلية التوسع المحدودة
غالبًا ما يكون لدى الشركات الكبيرة العديد من المشاريع والمهام تعمل بشكل متزامن - هنا تبدأ جداول بيانات Excel في الكشف عن أوجه القصور والتحديات التي تواجهها في التعامل مع كميات كبيرة من البيانات والمشاريع المعقدة.
يحتوي تنسيق Excel الأخير على 1,048,576 صفًا و16,384 عمودًا. قد يبدو ذلك مساحة كبيرة على الورق، ولكن البيانات تتسع مع نمو الشركة. ويصبح هذا تحديًا إضافيًا إذا كانت مؤسستك تتعامل مع آلاف الحسابات في مدن وبلدان مختلفة.
خطأ في التحكم في الإصدار
أن استبيان الشبكة المالية العالمية وجد أن أكثر من 50% من مستخدمي جداول البيانات زعموا أنهم يقضون وقتًا طويلاً في التحقق من الأرقام يدويًا في كل مرة يقومون فيها بإجراء تغيير. 😳
TBH، هذا ليس استخدامًا مثمرًا للوقت الثمين.
يؤدي عدم وجود تحكم مناسب في الإصدار إلى إنشاء ملفات مكررة بمجموعات بيانات مختلفة فقط للتأكد من عدم ضياع العمل. لكن هذا نظام معيب. على أقل تقدير، يؤدي وجود أطنان من النسخ من نفس مجموعات البيانات إلى عدم التنظيم والارتباك عندما يتعلق الأمر بتسمية الملفات ومشاركتها وعرضها.
والأكثر من ذلك، من المحتمل أن يقوم الأعضاء بالكتابة فوق جداول البيانات عن طريق الخطأ، مما يؤدي إلى تأخيرات غير ضرورية. كما أن عدم قدرة Excel على تتبع التعديلات الفعلية في الوقت الحقيقي وتخزينها يهدد سلامة البيانات، خاصةً في الحالات التي تدير فيها عدة فرق أو أعضاء مصنفًا واحدًا.
وهذا أمر شائع جدًا!
التعافي من الكوارث
على الرغم من العمل الدؤوب على المصنفات الخاصة بك، فمن المحتمل أن تواجه ملفات تالفة. 😔
في بعض الحالات، قد تفشل أدوات الاسترداد في بعض الحالات عند محاولة إصلاح مصنفات Excel التالفة، وحتى الملفات المستردة قد لا تتضمن آخر تحديثاتك.
من ناحية أخرى، تزيل قاعدة البيانات عبر الإنترنت عناء الاضطرار إلى النسخ الاحتياطي واستعادة الملفات المفقودة.
في انقر فوق فإن النسخ الاحتياطية منتظمة وتلقائية بالكامل. تسهّل ميزة التبعية في ClickUp إدارة مشاريعك دون تعريضك لفقدان البيانات أو محاولات الاسترداد غير المجدية.
ClickUp: حل بديهي لتبعية المهام
يمكن إنشاء التبعيات وإظهارها في إدارة المشاريع بمساعدة Excel وبدائله -لكن ClickUp يجعل هذه العملية سهلة.
_ما هو ClickUp الذي تسألون عنه؟ 😎
ClickUp هو تطبيق شامل ومتكامل، شامل كل شيء أداة لإدارة المشاريع لكل احتياجات إدارة المهام - بغض النظر عن حجم فريقك أو مجال عملك أو حالة الاستخدام.

كيفية إضافة تبعية إلى علاقة في ClickUp
يعد ClickUp حلاً لإدارة العمل موثوقًا به من قبل فرق العمل في جميع أنحاء العالم، وهو حل لإدارة العمل مصمم ليكون مخصصًا، مع مئات من ميزات مرنة للفرق لـ تطوير المشاريع وإدارة المهام والعمل معًا، كل ذلك في مكان واحد. تبعيات ClickUp يتيح للفرق رسم العلاقات بين المشاريع والمهام والمستندات والتبعيات على منصة سهلة الاستخدام. في غضون نقرات على واجهة السحب والإفلات الخاصة به، يمكنك..
- ربط التبعيات ذات الصلةانقر فوق المهام والأفكار معًا
- تعيين التبعيات لمعرفة ما يأتي بعد ذلك
- الانتقال بين المهام ذات الصلة، وانقر فوق المستنداتودمج الأدوات الخارجية
- إنشاء روابط بين المستندات.
هذا هو الحلم ⬆️😍
سهولة استخدامه، ومجموعة أدواته المرنة و مكتبة القوالب المتنامية تجعل من ClickUp بديلاً لـ Excel %إكسيلبديلًا لـ Excel. وعلى عكس إدارة مشاريع Excel ، إدارة مهام ClickUp هي عملية سهلة وسريعة وخالية من الإجهاد.
كيفية الاستفادة القصوى من تبعيات مهامك في ClickUp
حسنًا، يبدو ClickUp رائعًا جدًا، ولكن ما هي بالضبط تبعيات ClickUp وكيف يمكنك استخدامها؟
كيفية إنشاء التبعيات في ClickUp
أنشئ مهمة جديدة أو افتح مهمة موجودة لبدء إنشاء التبعيات.
تحت خيار القائمة، قم بالتمرير لأسفل إلى علاقات، ثم اختر التبعية. في هذه المرحلة، من المهم أن تفهم أن هناك أنواعًا مختلفة من التبعيات في ClickUp. وتشمل هذه الأنواع
- انتظار على: وهذا يعني انتظار المهام التي تحتاج إلى إكمالها قبل مهمة محددة.
- الحظر: هذا يعني حظر المهام التي لا يمكن أن تبدأ حتى تكتمل مهمة محددة.
- المهام المرتبطة: من الناحية المثالية، هذه هي المهام المرتبطة ببعضها البعض ولكنها لا تعتمد على بعضها البعض بالضبط.
في هذه الحالة، المهمة الرئيسية هي إجراء بحث حول التحديات والأنظمة القائمة. لإضافة مهمة واحدة أو أكثر من المهام التي تنتظرها هذه المهمة المحددة، اختر تنتظرها من قائمة التبعيات.
حدد المهمة التي تنتظرها هذه المهمة من قائمة المهام المتاحة، ثم انقر فوق تم التنفيذ. قم بالشيء نفسه بالنسبة للمهام التي تصنفها عادةً ضمن حظر، و مهام مرتبطة، ثم انقر فوق تم التنفيذ لكل منها.

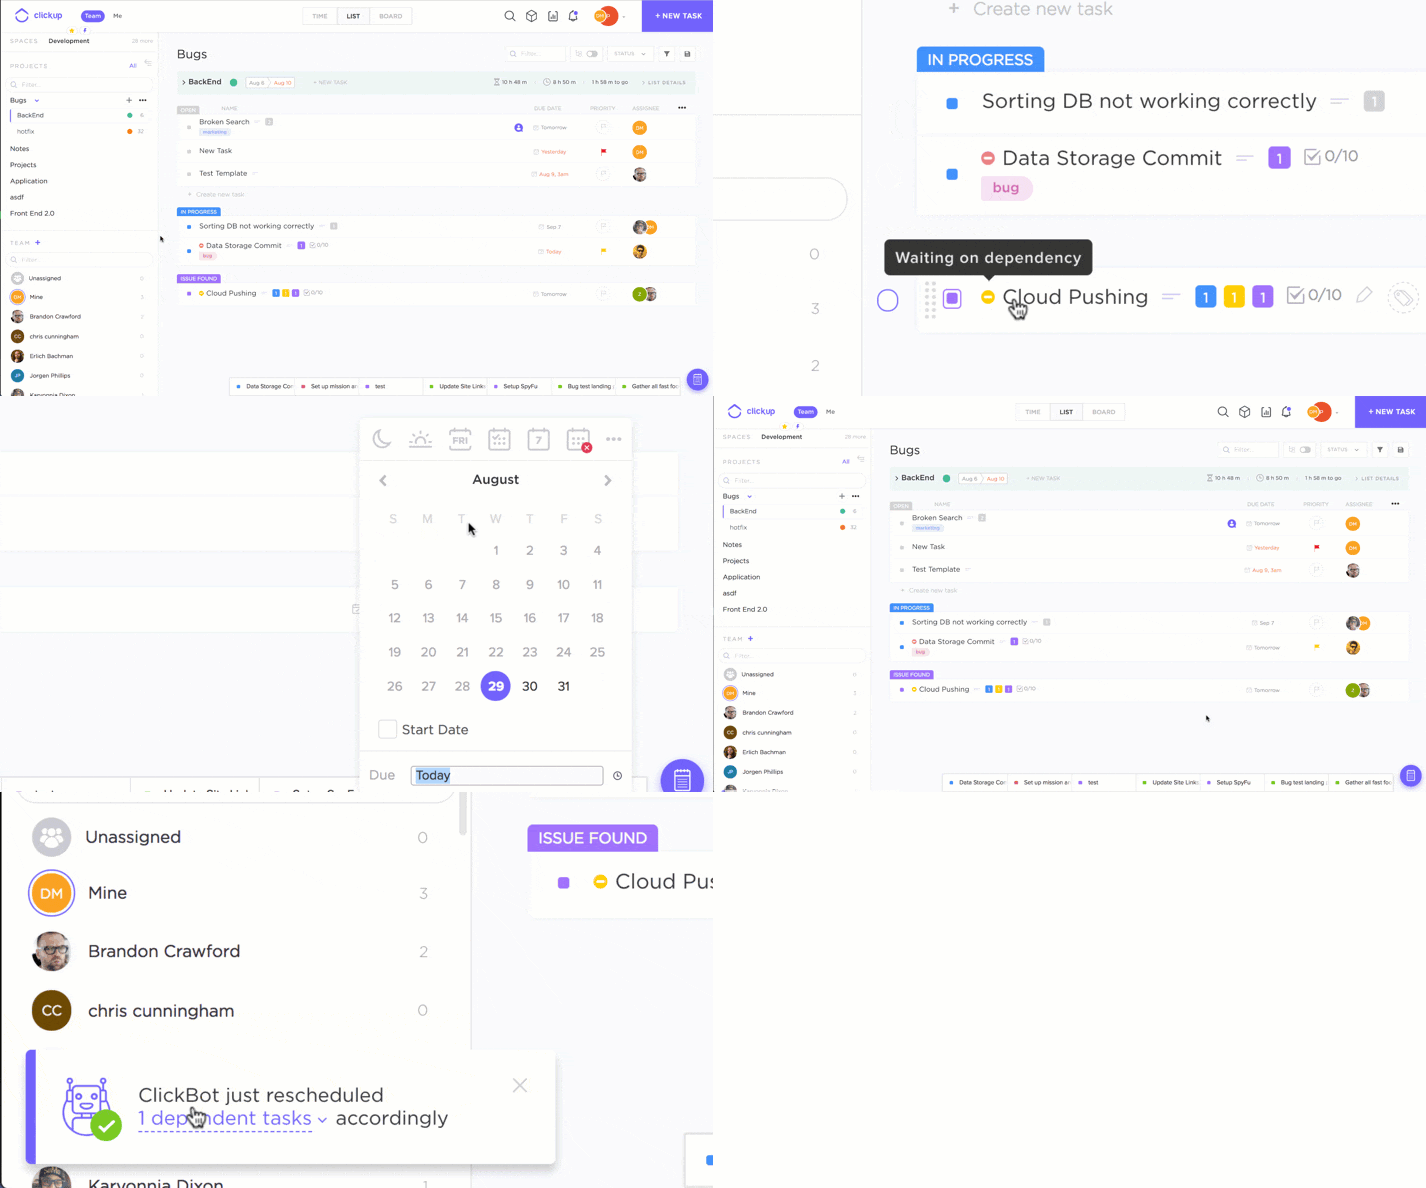
إعادة جدولة التبعيات مباشرة في ClickUp
كيفية إضافة التبعيات في عرض اللوحة أو القائمة
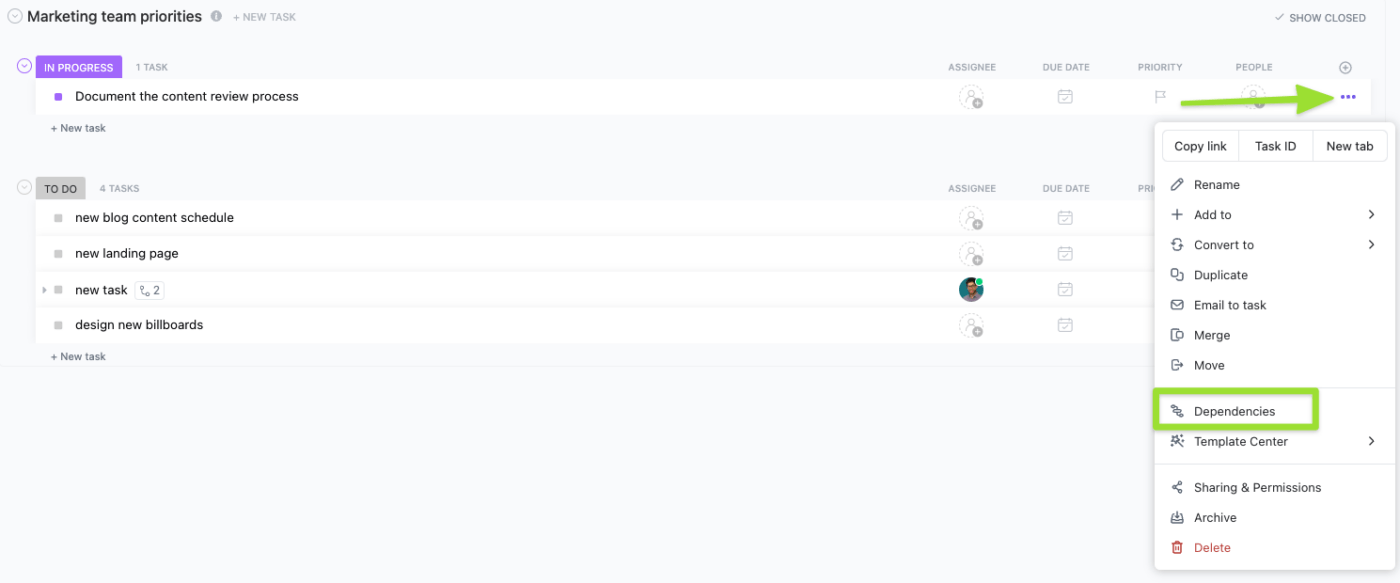
مرر المؤشر فوق مهام محددة، ثم انقر فوق قائمة التبعيات. اختر التبعيات من القائمة المنسدلة واعرض التبعيات الموجودة مسبقًا بالإضافة إلى إضافة تبعيات جديدة.

كيفية ربط المهام بشكل مجمّع
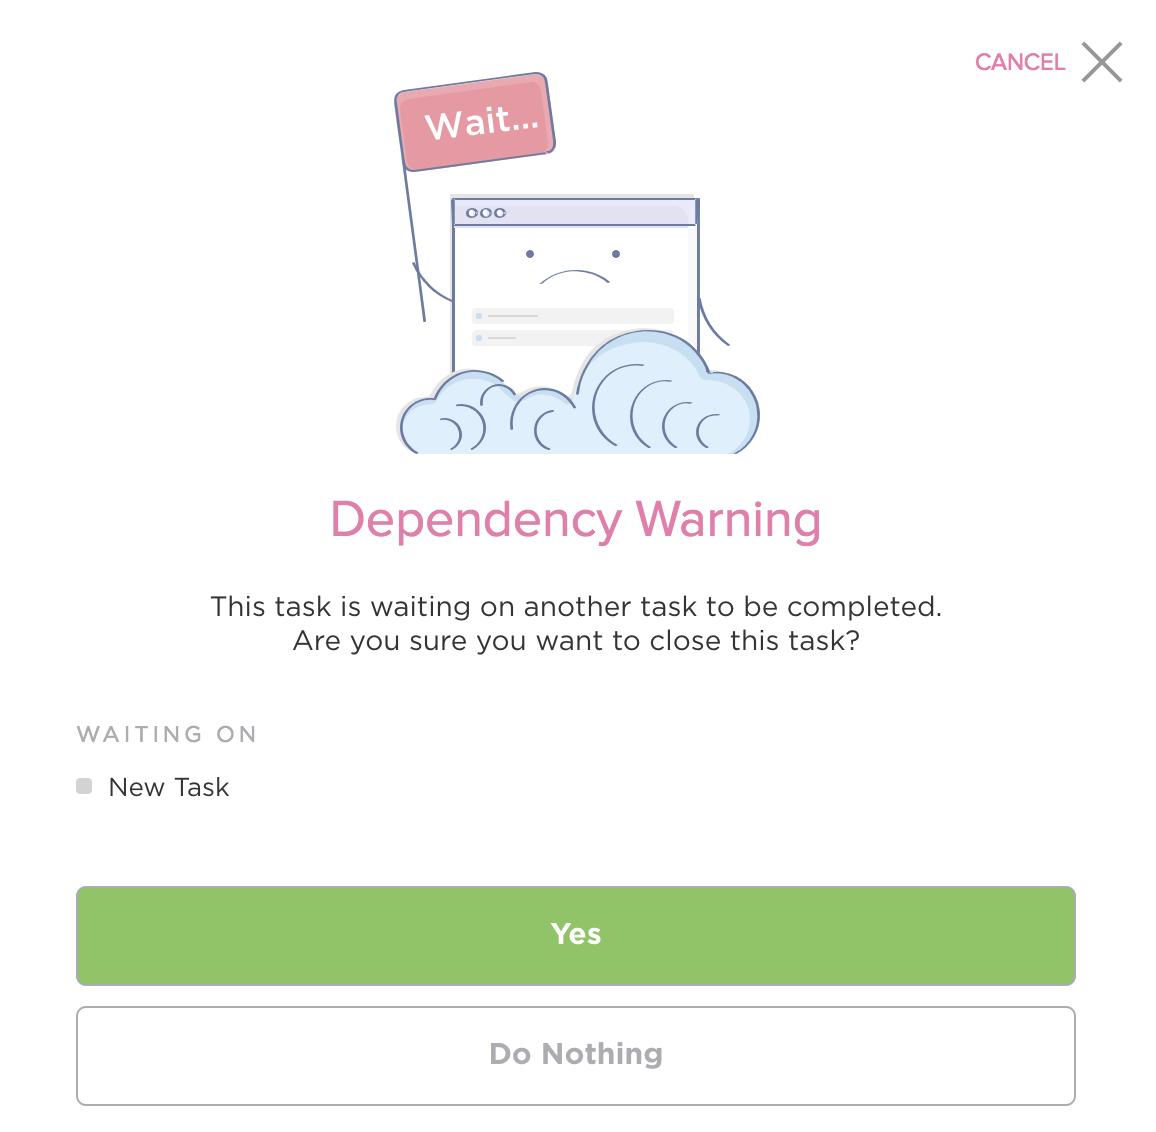
يمكنك بسهولة إنشاء روابط بين مهام متعددة. يمكنك إما ربط المهام بالمهمة الرئيسية أو فيما بينها. إذا كانت هناك مشكلة في الربط بمهام أخرى، فسيتم إعلامك بمطالبة تحذيرية بشأن تبعية أخرى.

يقوم ClickUp بتحذيرك عندما تكون هناك مهمة أخرى في انتظار إكمالها
تحقق من دليلنا على
/ href/ https://clickup.com/blog/dependency-graph-software//** أفضل برنامج رسم بياني للتبعية /%/%href/
!
كيفية إدارة التبعيات في طريقة عرض جانت عرض جانت في ClickUp بتصور التبعيات وتخطيط الوقت وإدارة الموارد لإدارة المهام بشكل أكثر تفصيلاً.
انقر على + عرض، ثم اختر جانت.
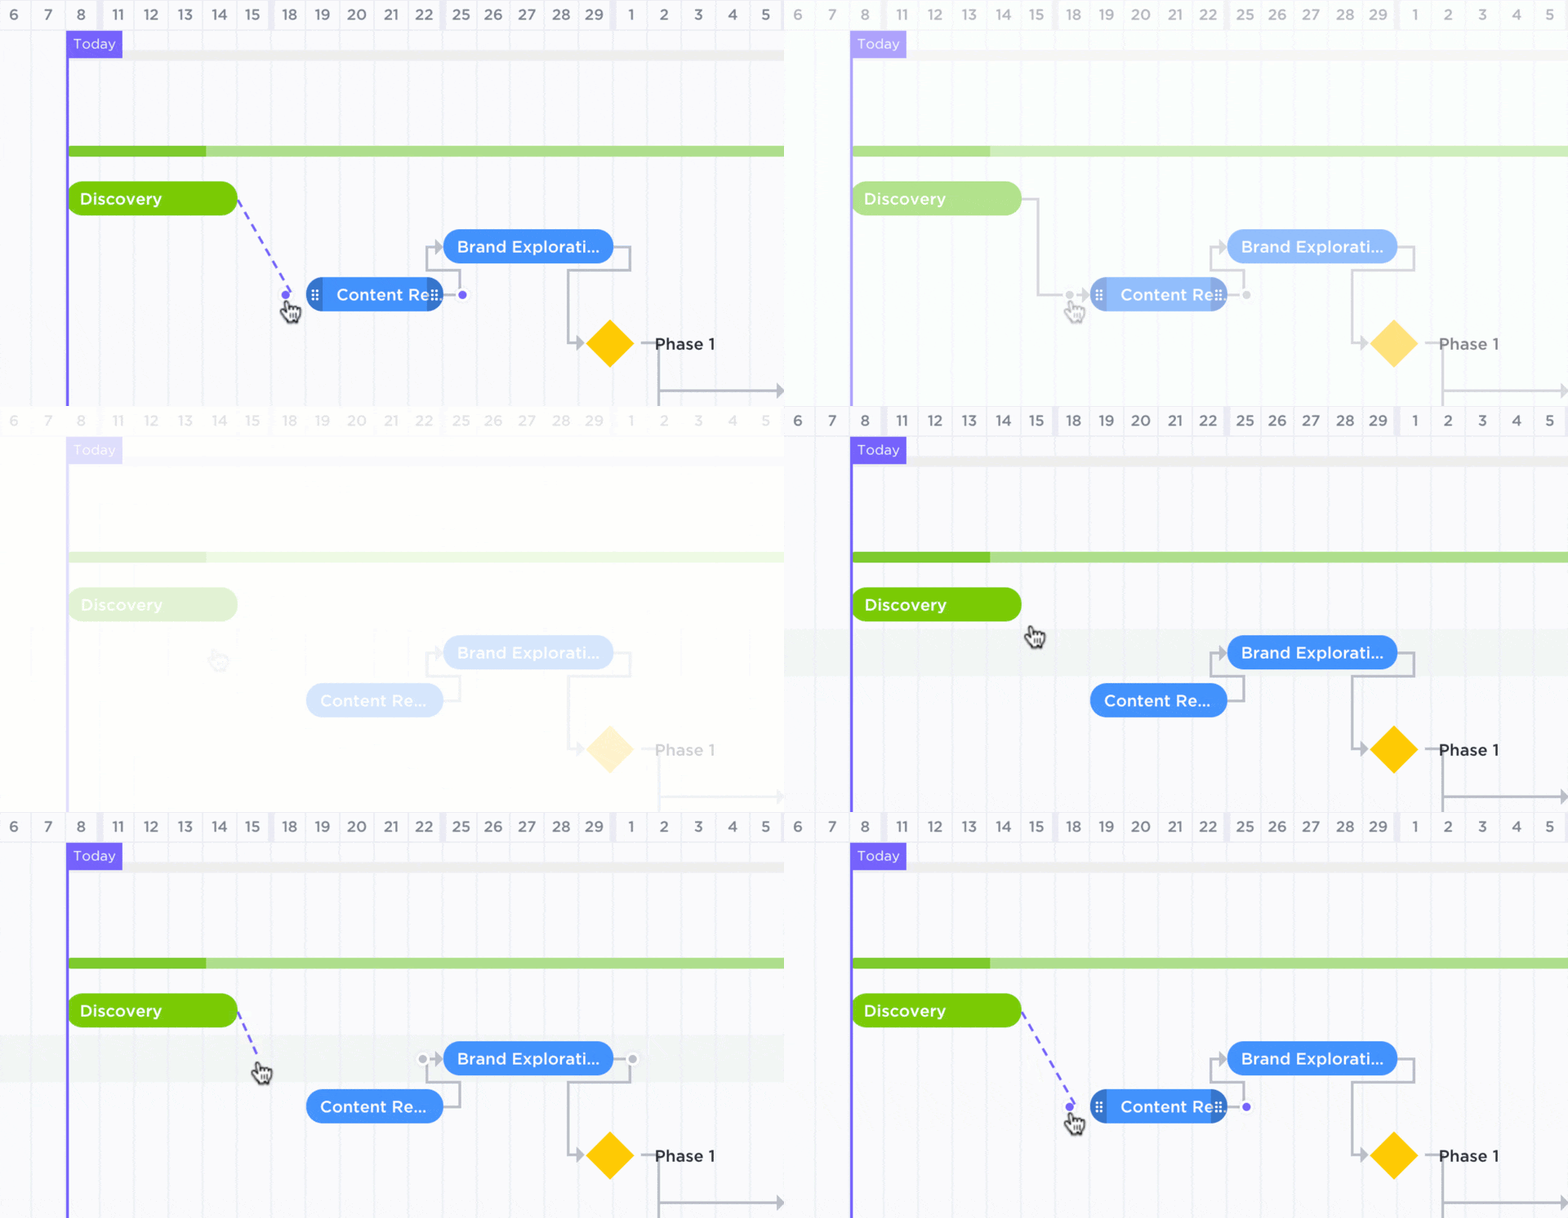
قم بتعيين تواريخ الاستحقاق لمهامك لتصور سير عملك، ثم اسحب الروابط بين المهام لنقل علاقات المهام والتبعيات على الفور.
بهذه البساطة!

رسم علاقة بين المهام والمهام المتطلبة في طريقة عرض جانت في ClickUp
يمكنك تسمية طريقة العرض وحتى تعيينها للعرض الخاص.
باستخدام ClickUp، لن تحتاج إلى تنزيل Gantt for Excel. إنه موجود بالفعل! تدير طريقة عرض Gantt مهامك بشكل شامل، مع ميزة إضافية تتمثل في تصوير أكثر وضوحًا لتبعياتك.
اعتمد على ClickUp لتلبية احتياجاتك من علاقات المهام الخاصة بك تبعيات المشروع ليست مفهومًا جديدًا في إدارة المهام. على الرغم من وجود العديد من الأدوات - بما في ذلك Excel - التي يمكنك استخدامها لإدارة مهام مشروعك، إلا أن القليل منها يوفر المزيج المثالي من قابلية التوسع وسهولة الاستخدام والموثوقية لإنجاز المهمة بأكثر الطرق فعالية ممكنة.
على الرغم من أنه لا يزال شائعًا على نطاق واسع، إلا أن قيود Excel لا تجعله الخيار الأفضل لإنشاء أو تصور تبعيات المهام.
هذا هو الغرض من ClickUp. 💜
يجمع ClickUp بين أدوات وميزات عالية الجودة لمساعدة الأفراد والفرق وحتى الشركات الكبيرة على إدارة كل شيء بدءًا من المهام اليومية إلى المشاريع المعقدة.
إن ميزات الاعتماد على المهام البديهية وعرض جانت المرئي للغاية هي مجرد بداية لما يمكن أن يقدمه ClickUp لك. والجزء الأفضل؟ يمكنه القيام بذلك مجاناً.
يمكنك الوصول إلى جميع هذه الميزات بالإضافة إلى عدد غير محدود من المهام والأعضاء، وسعة تخزين تبلغ 100 ميغابايت، وأكثر من 1,000 تكامل قوي بدون أي تكلفة على الإطلاق اليوم. إذاً، ماذا تنتظر؟ قم بالتسجيل في ClickUp للاستمتاع بميزات تبعية المهام السريعة والسهلة والموثوقة
أدلة Excel ذات الصلة:
- كيفية إنشاء لوحة كانبان في Excel
- كيفية إنشاء مخطط تنازلي في Excel
- كيفية إنشاء مخطط انسيابي في Excel
- كيفية إنشاء مخطط تنظيمي في Excel
- كيفية إنشاء لوحة تحكم في Excel
- كيفية إنشاء مخطط انحداري في Excel
