الشفافية المالية أمر بالغ الأهمية عند إدارة ميزانيات الأقسام والمشاريع عبر إنفاق الشركة. من الحملات التسويقية إلى البرامج إلى السفر وما بعده، تتراكم التكاليف بسرعة. وبدون رقابة ثابتة، يصبح من الصعب تبرير القيمة.
يعد نظام تتبع النفقات المبسط أمرًا ضروريًا لإعداد تقارير مالية واضحة. توفر الوثائق المصممة خصيصًا رؤية دقيقة لأماكن تدفق الأموال عبر المشروع والقسم والإنفاق على مستوى الفريق. تصبح التوقعات الأكثر إحكامًا وإثبات العائد على الاستثمار ممكنة للمبادرات الكبيرة والصغيرة. 🏆
من خلال التعليمات خطوة بخطوة، ستتعلم كيفية إنشاء تقارير إدارة النفقات في إكسل . استخدم هذا الدليل كنقطة انطلاق لتغذية المحادثات حول تحسين تطبيق سياسة الإنفاق في شركتك!
إذن ما هو تقرير النفقات التجارية بالضبط؟ دعنا نفحص بعض السمات الرئيسية لتقارير النفقات عالية التأثير.

ما هو تقرير النفقات التجارية؟
تقرير نفقات الأعمال هو مستند يتتبع إنفاق الشركة على المنتجات والخدمات والأجور والتكاليف الأخرى. يحتوي المستند على صفوف وأعمدة تسجل تاريخ النفقات المدرجة ووصفها وموردها ومقدارها وفئتها وتفاصيل أخرى.
تُستخدم علامات تبويب Excel داخل جدول البيانات لفصل النفقات حسب القسم أو المشاريع أو الأفراد أو أنواع أخرى. تحسب الصيغ مجاميع الإنفاق حسب الأسبوع أو الشهر أو ربع السنة أو أي نطاق تاريخي محدد.
مع تتبع النفقات، يمكن للمديرين الإجابة عن الأسئلة الأساسية التي تؤثر على عمل المشروع و تخصيص الموارد : هل ميزانيات المشاريع هل تتوافق مع التكاليف الفعلية؟ هل تصل النفقات إلى رموز GL الصحيحة؟ ما هي التكاليف التي ترتفع بسرعة؟
تشمل فوائد استخدام Excel لتنظيم كشوف النفقات ما يلي:
- تتبع ميزانية القسم: عرض الإنفاق الفصلي أو السنوي مقارنةً بالميزانية المخصصة
- دقة التنبؤ: تحديد اتجاهات الإنفاق السابقة للتنبؤ بنفقات الشركة المستقبلية
- التنظيم: التنظيم: الاحتفاظ بنموذج ونظام واحد وموحد لتقرير النفقات لتسهيل تدقيق الإيصالات والفواتير
نأمل أن تحقق مستوى صحيًا من البيانات المنظمة حتى لا تفاجأ بتغييرات الميزانية في اللحظة الأخيرة وأن تكون لديك الصورة المالية الأكثر دقة. وهذا يقودنا إلى الحدث الرئيسي: _إعداد إدارة النفقات!
كيفية إنشاء تقرير نفقات الأعمال في Excel
قبل أن نبدأ، دعنا نغطي المكونات الأساسية اللازمة:
- أي إصدار Excel: سنستخدم وظيفة جداول البيانات العامة
- إيصالات النفقات والوثائق: جميع سجلات المعاملات التي يجب إدخالها (لماذا لا نبدأ بتقرير النفقات التالي؟)
- فئات النفقات: حدِّد قائمة بأنواع النفقات ذات الصلة بعملياتك
مع جمع الأساسيات الخاصة بك، لدينا جميع المكونات لتخصيص قالب تقرير النفقات في Excel. لننتقل مباشرةً إلى الدليل التفصيلي خطوة بخطوة!
الخطوة 1: قم بتنزيل قالب تعقب النفقات المجاني الخاص بنا
بدلاً من إنشاء أداة تعقب النفقات من الصفر، استخدم قالب تقرير نفقات Excel المجاني كبداية. فهو يحتوي بالفعل على حقول التتبع القياسية للتواريخ/الموردين/المبالغ والصيغ المبنية مسبقًا لجمع الإجماليات تلقائيًا حسب الفئة. استبدل البيانات الوهمية بنفقات عملك مع الاحتفاظ بالصيغ المدمجة. 🧪
ما عليك سوى فتح ملف التنزيل لمتابعة الخطوات أدناه!
 تنزيل قالب إكسل
الخطوة 2: إعداد معلومات الرأس
في الجزء العلوي، أدخل التفاصيل الأساسية لتحديد التقرير:
- مُعد من أجل: أضف اسم الموظف أو القسم الذي تكبد النفقات
- مقدم من قبل: اذكر من قام بإعداد/المساهمة في معلومات النفقات وجدول البيانات
- الغرض: الغرض: اشرح بإيجاز سبب التقرير (اجتماع الميزانية الأسبوعي، طلب المدير، العمليات العامة للقسم)
- فترة النفقات: أدخل تواريخ البداية والنهاية (اليوم والشهر والسنة المكونة من 4 أرقام) المشمولة بنطاق تاريخي لجميع المعاملات الموثقة

استخدام رؤوس الأوراق لإعطاء السياق والوضوح لمراجعي الميزانية
الخطوة 3: إعداد فئات النفقات
لم يتم تضمين القوائم المنسدلة في قالب جدول بيانات النفقات للتغطية على جماليات Excel، كيف نقولها، "العارية".
إنها تخدم غرضًا ضروريًا للغاية يتمثل في التصنيف النظيف والاتساق عبر جميع المعاملات على مستوى الشركة.
يمتد هذا إلى إدخال البيانات أيضًا. تُعد القوائم المنسدلة وسيلة آمنة لمعالجة البيانات الخالية من الأخطاء والتحليل المبسط. يمكن أن يؤدي خطأ إملائي واحد في كتابة نوع المصروفات أو رمز التكلفة إلى اختلال كل شيء. ⚖️
إليك كيفية تثبيت الفئات الخاصة بك عبر القوائم المنسدلة:
- انقر فوق بند اللوازم المكتبية (الخلية B18)، وستظهر أيقونة سهم القائمة المنسدلة
- انتقل إلى شريط أدوات القائمة في الأعلى، وانقر على البيانات > التحقق من صحة البيانات، _وستظهر نافذة منبثقة
- تحت الحقل النصي المصدر، أعد كتابة القائمة لتتناسب مع فئات المصروفات في عملك. افصل بين كل فئة بفاصلة. (نوصي بإدراجها بالترتيب الأبجدي لتسهيل التنقل!)
- انقر على تطبيق عند الانتهاء، وراجع قائمتك الجديدة بالنقر على أيقونة سهم القائمة المنسدلة
- كرر العملية نفسها للعناوين المنسدلة الأخرى: البائع و التكلفة و المركز و الرمز و طريقة الدفع و حالة_ الدفع
- لتعديل الفئات في المستقبل، قم بإضافة نص أو إزالته في الحقل النصي المصدر حسب الحاجة

تحرير الفئات المبنية مسبقًا لتتبع نفقات الأعمال التجارية المتسقة
الخطوة 4: ملء القالب ببنود السطر
أخيراً، أضف كل مصروفات العمل الفردية كصف خاص بها. الأمر كله يكمن في التفاصيل، لذا قم بتضمين أكبر قدر ممكن من السياق لتوثيق مالي واضح.
- تاريخ النفقات: اليوم والشهر والسنة التي حدثت فيها النفقات
- فئة المصروفات: فئة المصروفات (التسويق، السفر، الرسوم المهنية)
- البائع: الاسم القانوني الكامل للشخص أو الشركة الذي يطابق الاسم القانوني الكامل للشخص أو الشركة الذي يطابق W-8 أو W-9 . (لا تزعج محاسبك بالأسماء المستعارة)
- رمز مركز التكلفة: مركز التكاليف الداخلي من مخطط حساباتك الذي ترتبط به تلك النفقات
- وصف المصروفات: وصف موجز يوضح تفاصيل المعاملة
- المبلغ: المبلغ: مبلغ المصروفات بالدولار
- طريقة الدفع: طريقة الدفع: كيفية دفع المبلغ (بطاقة ائتمان، نقدًا، شيك)
- حالة الدفع: حالة الدفع: النفقات المدفوعة أو المعلقة
ستلاحظ أننا أضفنا ما مجموعه 7 خيارات لحالة الدفع. لا يعرف البائعون لديك أصدقائك الماليين المجتهدين كما تعرف أنت، لذا فإن هذه المراحل الدقيقة من عملية السداد تخلق شفافية في الجداول الزمنية حول النفقات المتكبدة. يساعد السياق الإضافي مديري المشاريع على التنقل في المحادثات مع البائعين الذين ينتظرون السداد. 💬
تعمل خيارات التخصيص الصغيرة ولكن المهمة على تحويل جدول بيانات النفقات إلى محرك رؤية مالية. ستعيش هذه المستندات في سجلات شركتك، لذا فإن المزيد من السمات تضيف قيمة تحليلية.

السماح للفرق بتتبع المدفوعات عن كثب من خلال عملية الإصدار
الخطوة 5: إجمالي النفقات حسب الفئة
تحتوي الخلايا المميزة على صيغ مبنية مسبقًا لتوفير إجماليات لكل فئة من فئات المصروفات. يسمح ذلك بتتبع توزيع النفقات لكل فئة.

إجمالي النفقات تلقائيًا حسب الفئة
أخبار جيدة لا حاجة للعمليات الحسابية من جانبك! 🤩
الأخبار السيئة هناك عقبة 👀
نحن نماطل الآن لأن الخطوة التالية تتطلب مستويات جيدي من الصبر. حتى الآن، لديك حتى الآن جميع البنود الخاصة بك في ورقة النفقات الخاصة بك. بعد ذلك، ستحتاج إلى إرفاق الإيصالات والمستندات المصدرية الأخرى.
الخطوة 6: أضف الإيصالات والمستندات المصدرية ذات الصلة
نتمنى أن نخبرك أن هذه العملية سهلة في Excel، لكن إرفاق الملفات يصبح صعباً بسرعة. أولاً، سيتعين عليك تحويل كل إيصال إلى ملف PDF منفصل بدلاً من JPEG. ثم، قم بتسميتها بتنسيق مناسب يمكن لـ Excel تخزينه بسهولة.
لإضافة الملفات، ستحتاج إلى وظائف الكائنات و/أو وظائف ربط الكائنات وتضمينها (OLE) المتقدمة في Excel. يصبح أداء ما يجب أن يكون مهمة أساسية أمرًا شاقًا. على سبيل المثال، الملفات غير التابعة لـ Microsoft لها عملية تحميل معقدة. الوظائف الموجودة على شريط أدوات القائمة التي يجب أن تكون قابلة للنقر عليها غير نشطة، لذا فإن الأمر يتطلب بعض التجربة والخطأ.
إذا كنت تستخدم بالفعل جدول بيانات Microsoft Excel على الويب، فإن أفضل طريقة وأكثرها فعالية هي استخدام OneDrive من Microsoft. هذا من شأنه أن يحل بعض المشاكل التي من المحتمل أن تواجهها الفرق مع تطبيقات Excel:
- ستتيح الملفات في مخزن الملفات المستند إلى الويب إمكانية الوصول إلى البيانات عبر المتصفح
- لن تحتاج الفرق إلى تثبيت Excel على جميع أجهزتها للتعاون على البيانات
- يمكن لأي شخص العمل على البيانات باستخدام Excel، حتى لو كانوا يعملون من إصدارات مختلفة
حتى أكثر المستخدمين تقدماً يجب أن يستخدموا نفس الأطواق لربط الملفات الخارجية.
ولكن إذا كنت ترغب في أن تكون في الجانب المظلم من القوة، فإن منصة الإنتاجية التي تتجاوز مجرد قالب تقرير النفقات البسيطة هي المكان الذي تحدث فيه التحالفات والشراكات الاستراتيجية.
رحّب بـ ClickUp! 👋

أنشئ تقرير النفقات باستخدام أكثر من 15 طريقة عرض وأتمتة ClickUp
3 قوالب لإنشاء مجموعة أدوات الرقابة المالية الآلية
لطالما كان برنامج Excel هو البرنامج القديم لتتبع النفقات، إلا أن قيوده المتعلقة بالتعاون والمرونة والوظائف تجعل من الضروري ترحيل الوثائق المالية الأساسية مثل تقارير النفقات إلى منصات إنتاجية مخصصة مثل ClickUp بدلاً من ذلك.
من خلال تدفقات العمل الآلية القابلة للتخصيص للموافقات، والتحرير بالسحب والإفلات، والأذونات المستندة إلى الأدوار، ووظائف الذكاء الاصطناعي، ونماذج النفقات، وتصورات اتجاهات الإنفاق، يمكن لشركتك اتخاذ قرارات مستنيرة بشكل أسرع. 📊
لقد قمنا باختيار ثلاثة نماذج نفقات في ClickUp لإظهار كيف أن أدوات ClickUp سهلة الاستخدام تدفع قدرات التوثيق المحاسبي إلى الأمام مقارنةً بأوراق Excel الثابتة التي تعاني من مشاكل الإصدار.
ملاحظة: لا مزيد من الأخبار السيئة من هنا!
1. قالب ClickUp للمصروفات والتقارير التجارية
الأفضل لـ استبدال صراعات الامتثال بحلول قابلة للتنفيذحلول قابلة للتنفيذ

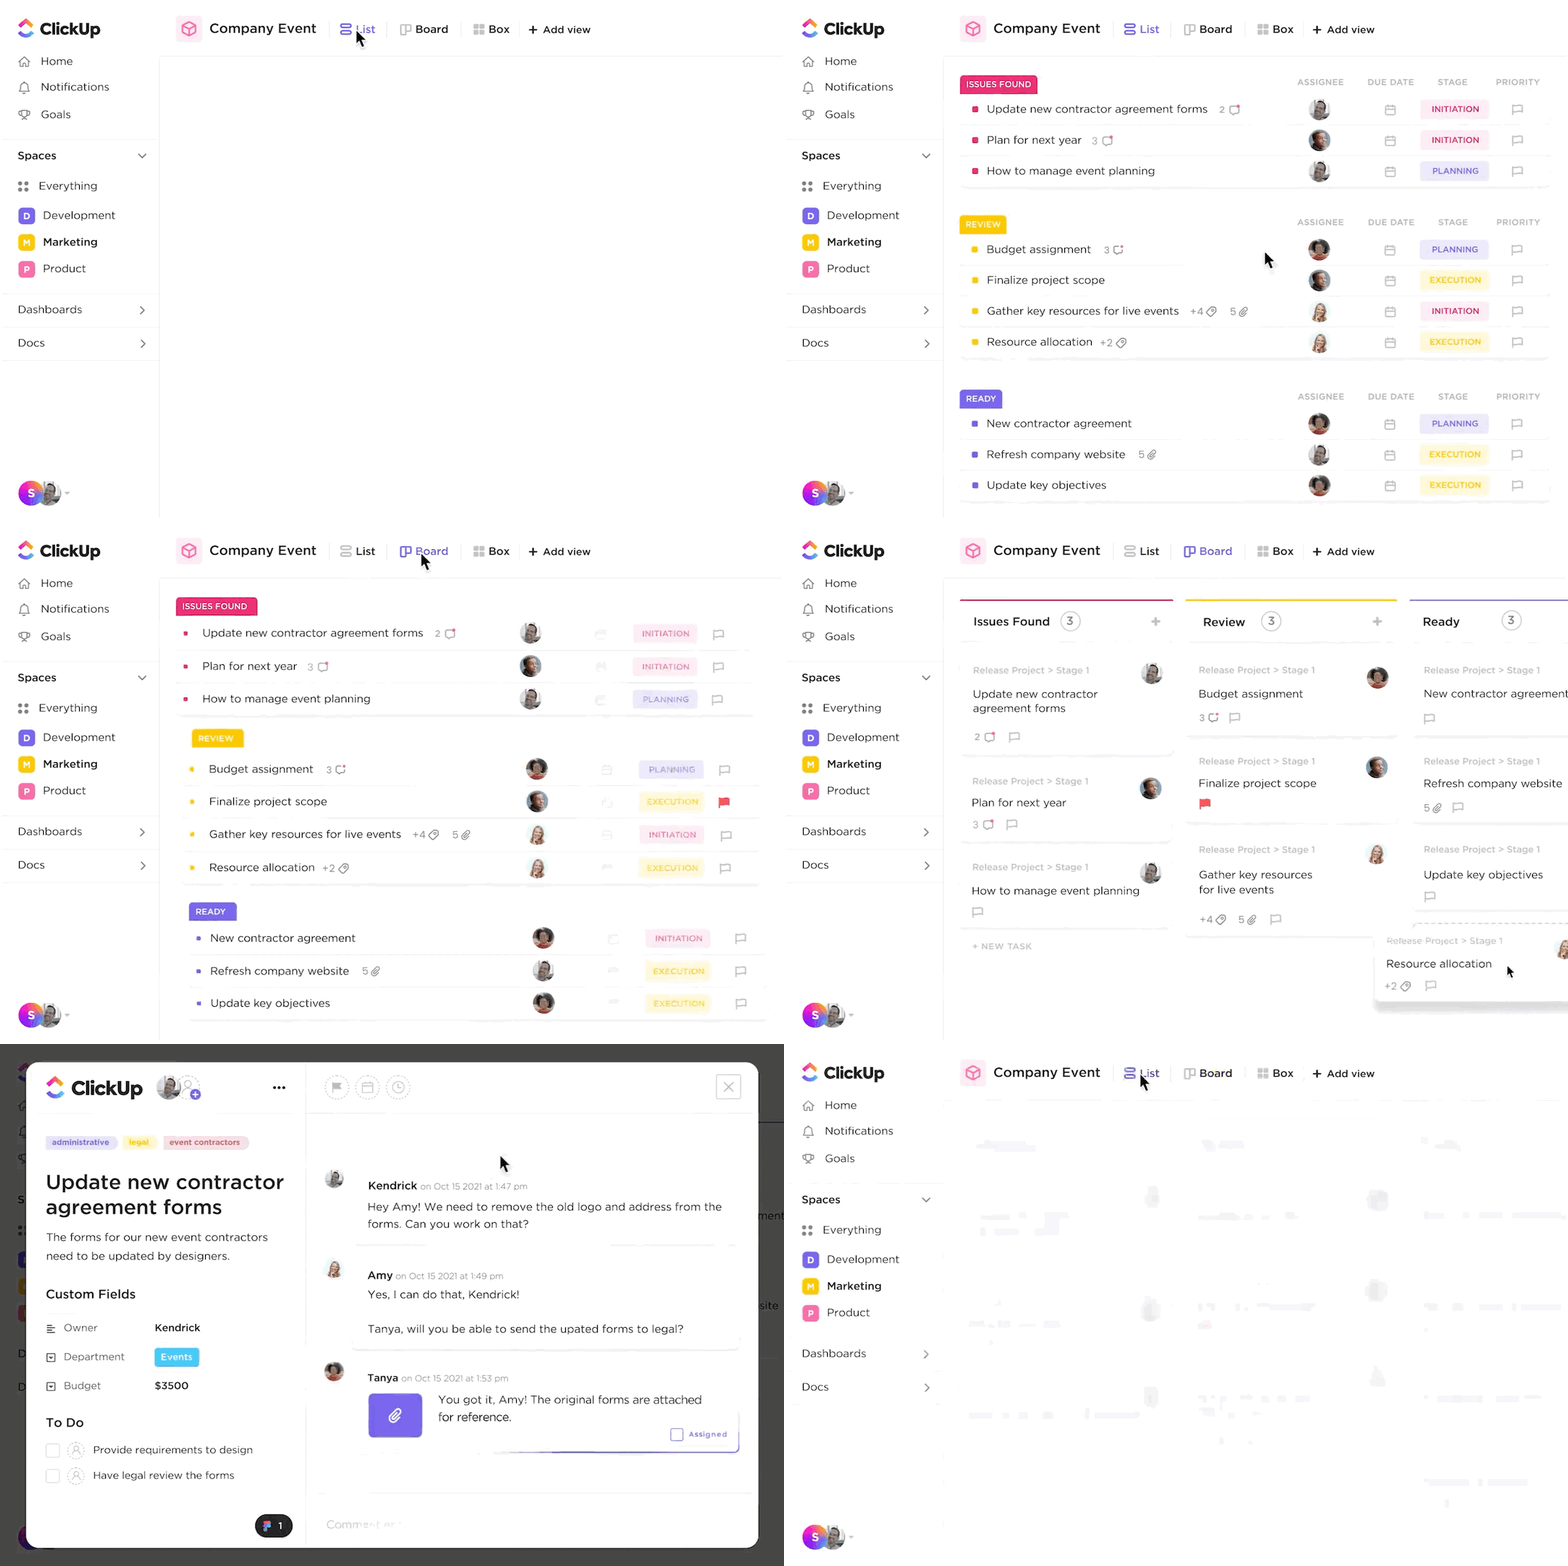
استخدم طريقة عرض جدول ClickUp للتعاون في مهام النفقات مع شركاء المحاسبة
الـ قالب تقرير ونموذج نفقات الأعمال التجارية ClickUp وتتضمن جميع قوالب ClickUp طرق عرض قابلة للتخصيص لتحسين تكوينات التقارير والموافقات والعلامات وغيرها.
إذا لم تكن معتادًا على طرق العرض في برامج إدارة المشاريع، ففكر فيها كمجلدات أو فواصل مختلفة في خزانة ملفات واحدة. تقوم كل طريقة عرض بتجميع المعلومات المنسقة معًا ولكن يتم عرضها بشكل مختلف لتتناسب مع معايير محددة بناءً على ما هو أكثر أهمية للشخص أو الغرض.
يفتح عمق التخصيص في هذا القالب الباب أمام التعاون على مستوى الفريق داخل منصة ClickUp. لا يتعين على أقسام المحاسبة والمالية والأقسام الأخرى إنشاء تقارير إضافية أو ملاحقة المعلومات عبر البريد الإلكتروني. 📥
بدلاً من ذلك، تقلل ClickUp من العمل المزدوج من خلال تسهيل وصول جميع أعضاء مساحة العمل إلى المعلومات المشتركة في مكان واحد. سياق أفضل يعني محادثات مثمرة عندما يحين وقت تسوية تقارير النفقات.
تصبح حالات مثل انتهاكات السياسة أو تغيير الميزانيات أسرع في اكتشافها. ونتيجة لذلك، يتمتع مديرو المشاريع برؤية أكبر لأنماط الإنفاق وفرص التوفير والتناقضات.
قم بإقران هذا القالب بـ قالب إعداد الضرائب ClickUp **_لتحسين إعداد الضرائب مع إمكانيات تتبع الوقت والعلامات وتحذيرات التبعية ورسائل البريد الإلكتروني والمزيد!
2. قالب تقرير نفقات الأعمال الصغيرة ClickUp
الأفضل لـ إدارة مهام التدبير المنزلي للبائعين ومهام الدفع

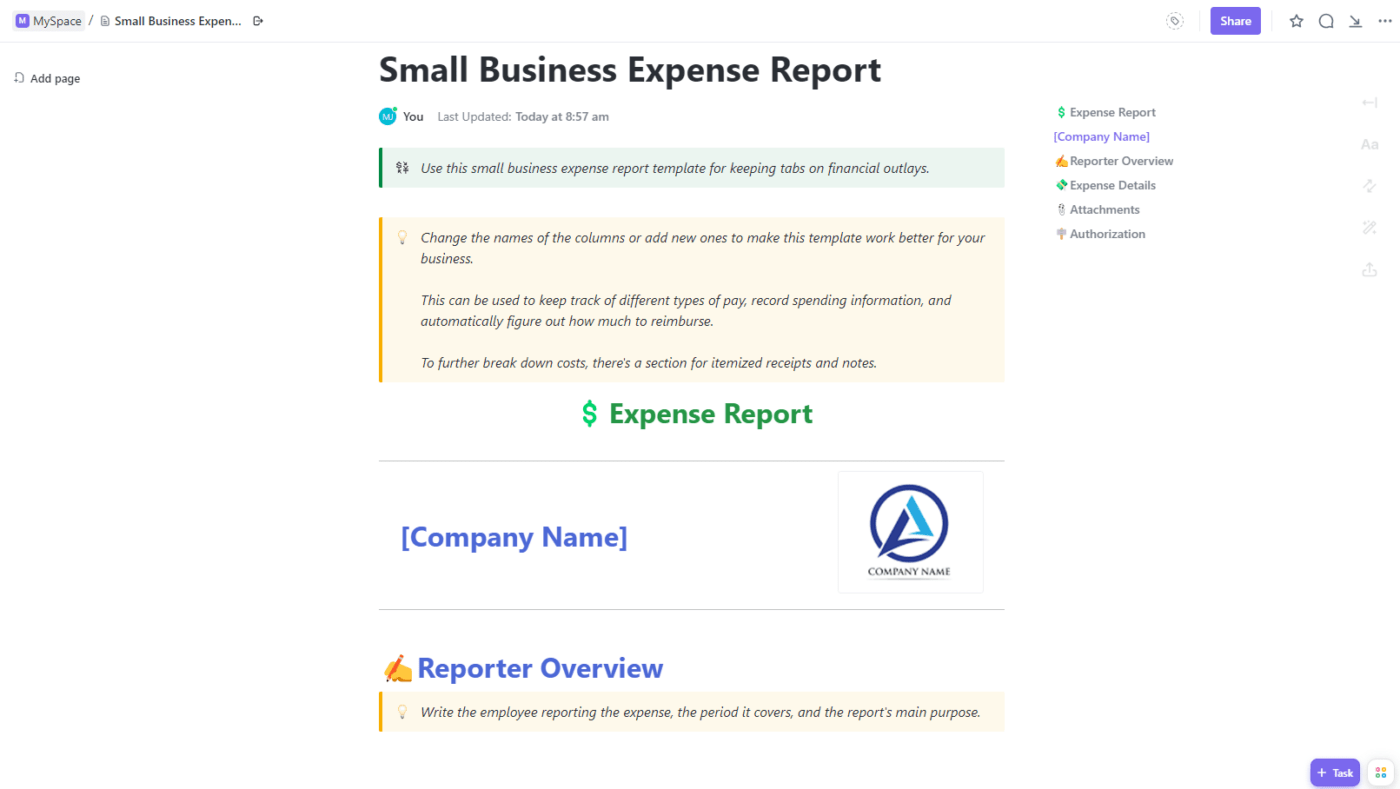
تقسيم النفقات المتعلقة بالسفر مع فئات فرعية في مستند ClickUp
إن تبسيط إعداد التقارير هو مجرد فائدة سطحية لـ قالب تقرير نفقات الأعمال الصغيرة ClickUp . مواءمة إدارة المشاريع والمحاسبة تحت سقف واحد. تعمل الجداول الزمنية المتكاملة على ربط النفقات بالمخرجات والعملاء والفواتير حتى تتمكن من زيادة الكفاءة المالية والتشغيلية إلى أقصى حد.
صُمم هذا القالب لأصحاب الأعمال والفرق الصغيرة، ويساعد هذا القالب في إدارة التدبير المنزلي للموردين، لذلك طلب المدفوعات والمتطلبات التنظيمية لا يتم التغاضي عنها. 🔍
جميع أدواتك في متناول يدك داخل المنصة:
- ميزات الاستيراد والتضمين لـ Excel وجداول بيانات Google وتطبيقات العمل الأخرى
- تذكيرات أتمتة المهام لإدارة التجديدات والمراجعات
- تقارير لوحة المعلومات للحصول على نظرة عامة على النفقات حتى الآن
- حقول مخصصة لتتبع تفاصيل الموردين
من خلال هذه الميزات ومئات من أدوات التعاون والتكاملات الأخرى في ClickUp، يمكن للشركات الصغيرة تنسيق الشراكات الداخلية والخارجية دون عناء.
قم بإقران هذا القالب مع قوالب مسك الدفاتر **_لتتبع أصول شركتك وخصومها وحقوق الملكية الخاصة بها!
3. قالب تقرير مصاريف ClickUp
الأفضل لـ التحكم في إنفاق الشركةالتحكم في إنفاق الشركة

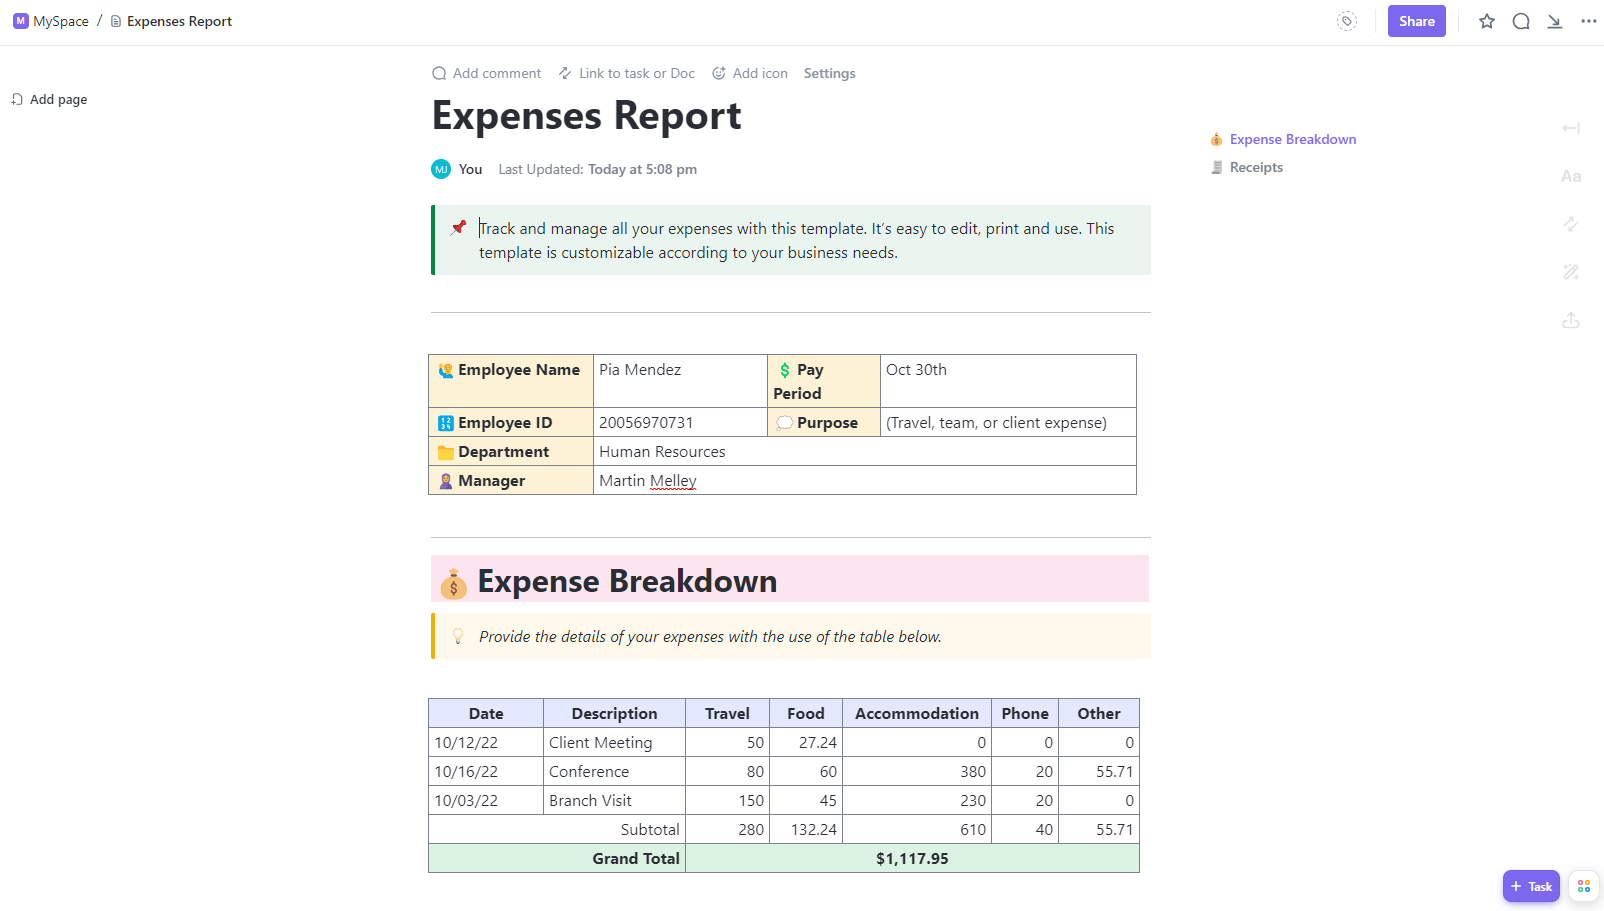
راقب البائعين الذين يتم الدفع لهم بطرق دفع معينة للتتبع الدقيق
يجب على الشركات القائمة والوكالات المهتمة بالتكاليف استخدام قالب تقرير مصاريف ClickUp لتقديم الرؤى المالية الاستراتيجية بسرعة. احصل على الصورة الكبيرة ورؤى البنود المطلوبة لتحسين الإنفاق على النمو. ⚡️
جرّب الأدوات المدمجة للتنبؤ بالميزانية المستقبلية والاحتياجات من الموارد بناءً على الأداء السابق. عمليات التكامل تربط عمل العميل بالنفقات بينما أدوات إعداد التقارير ومهام سير العمل توفر وقت مديري المشاريع في تعقب الرسوم التي تم الإبلاغ عنها بواسطة المحاسبة.
وبفضل أدوات تبسيط الإشراف على النفقات وتنفيذ الواجبات الوظيفية الضرورية، بما في ذلك الحقول المرنة لتنظيم المدفوعات والمبالغ، يتمتع المديرون بالقدرة على تكييف تتبع النفقات بما يتناسب مع سير العمل.
قم بإقران هذا القالب مع قالب نموذج الدفع ClickUp **_لإنشاء نماذج سهلة الاستخدام عبر الإنترنت!
تدريب إضافي على برنامج Excel مفتوح
بينما يركز هذا الدليل على إنشاء تقرير النفقات الخاص بك، يمكن أن يدعم Excel احتياجات العمل الأخرى - عند تنفيذه بشكل صحيح.
نظرًا للأشياء التي كشفنا النقاب عنها والتي يقدمها ClickUp للشركات، لدينا المزيد من الموارد والنصائح والقوالب لإضافتها إلى معرفتك ببرنامج Excel. اطّلع على هذه الأدلة الإضافية وأفضل الممارسات عندما يحتاج Excel إلى التألق! ✨
إدارة الوقت والتتبع
تعرّف على كيفية إنشاء تقويمات وجداول زمنية وجداول زمنية وجداول زمنية وغير ذلك في Excel لتخطيط أيامك وتتبع العمل.
- كيفية إنشاء تقويم في Excel
- كيفية حساب الوقت في Excel
- كيفية إنشاء جدول زمني في Excel
- كيفية إنشاء قائمة المهام في Excel
تصور البيانات ولوحات المعلومات
اجعل بياناتك في Excel مؤثرة من خلال هذه البرامج التعليمية المتعمقة لتحويل معلومات جدول البيانات إلى مرئيات أنيقة!
- كيفية إنشاء لوحة مؤشرات الأداء الرئيسية في Excel
- كيفية إنشاء لوحة تحكم في Excel
- كيفية إنشاء رسم بياني في Excel
إدارة المشاريع
قم بإنشاء المخططات البيانية المتقادمة، ومخططات جانت، ولوحات كانبان، والمزيد في Excel لتخطيط وإدارة سير العمل.
- كيفية إنشاء مخطط تنازلي في Excel
- كيفية إنشاء لوحة كانبان في Excel
- كيفية إنشاء مخطط جانت في Excel
- كيفية عرض هيكل تقسيم العمل في Excel
- كيفية إنشاء جدول زمني للمشروع في Excel
التنظيم
ترتيب معلومات الشركة والموظفين مع الأدوات التنظيمية في إكسل
- كيفية إنشاء قاعدة بيانات في Excel
- كيفية إنشاء مخطط هيكلي في Excel
مكافأة: تحقق من قوالب تقارير النفقات من مايكروسوفت إكسل!
قم بترقية مهام سير عمل النفقات الخاصة بك باستخدام طرق عرض ClickUp
في نهاية المطاف، المفتاح هو ضمان الشفافية وسهولة الوصول والدقة في إعداد تقارير النفقات بحيث تتحرك الأموال على النحو المنشود تماماً.
نأمل أن يكون هذا الدليل قد قدم إمكانيات ترقية إدارة النفقات سير العمل. يعد إعداد تقارير النفقات جهدًا جماعيًا حقيقيًا، ويجب ألا تكون الفرق التي تتطلع إلى تلبية احتياجات وتفضيلات الرقابة مقيدة ببرنامج Excel. 🧑💻
سواءً اخترت جداول البيانات المجربة والحقيقية أو المحاور المركزية الأحدث، فإننا نقول: "لماذا لا تختار الاثنين معًا؟ ابدأ مساحة عمل مجانية في ClickUp أو استيراد جداول البيانات الخاصة بك إلى عرض جدول ClickUp Table!

