Gantt Chart Template for Google Sheets
The Milestone Gantt framework built in Google Sheets with phase gate tracking, RAG status indicators, and baseline comparison columns designed for executive reporting and steering committee updates.
Gantt Chart Template for Google Sheets
A collaborative Google Sheets template for milestone-level Gantt tracking with RAG status indicators, baseline comparisons, and a one-page layout built for executive updates.
Free, ungated, opens in Google Sheets
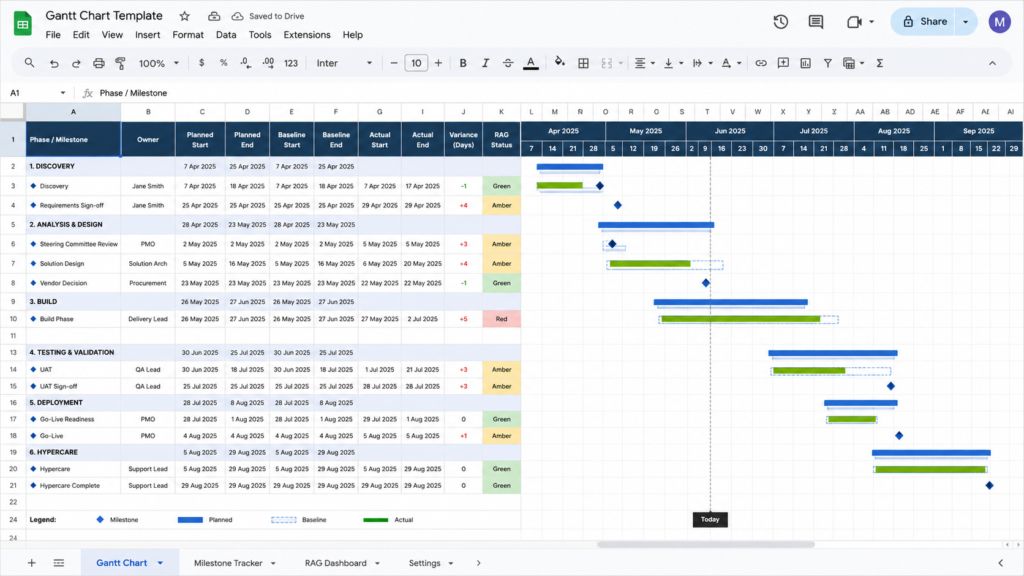
- Conditional formatting timeline bars for phases and milestones
- Milestone markers with type classification (Deliverable, Decision, Review)
- RAG status column with color-coded conditional formatting
- Baseline vs actual date comparison columns
- Variance calculation with automatic red/green highlighting
- Phase-level summary rows with date rollup
- One-page printable landscape layout
How to Use This in Google Sheets
Make a Copy of the Template
Click the template link, then go to File > Make a copy. Your personal copy opens in Google Drive with all formulas and conditional formatting intact. Rename it with your project name.
Define Your Project Phases
Replace the sample phases in Column A with your actual project phases. Enter planned start dates in Column C and planned end dates in Column D. The conditional formatting draws timeline bars automatically as you enter dates. For milestones, enter the same date in both columns to render a diamond marker.
Set RAG Status for Each Phase
Use the dropdown in Column F to set each phase to Green (on track), Amber (at risk), or Red (delayed). The conditional formatting color-codes the entire row to match, giving stakeholders an instant visual health check.
Track Actual Dates and Variance
As phases complete, enter actual start and end dates in Columns G and H. The Variance column (I) calculates the difference in calendar days automatically. Positive values (highlighted red) indicate late delivery. Negative values (highlighted green) indicate early completion.
Share with Your Team and Stakeholders
Click Share in the top right corner. Add team leads with edit access to update their own phase status. Add executives with view-only access. Use Comments (Ctrl+Alt+M) to tag specific people for status update requests.
Who This Is For
Program Managers Running Steering Committees
PMO leads who need a clean, one-page project status view for executive audiences who will never open a task management tool.
Teams on Google Workspace
Organizations running Google Workspace who want a shared timeline without introducing a new tool, additional licensing, or mandatory onboarding.
Freelancers Sharing with Clients
Independent consultants who need to give clients view-only access to project milestones without asking them to create accounts in any tool.
Frequently Asked Questions
You can add task rows below each phase, but the conditional formatting is calibrated for phase-level bars. Adding more than 30 to 40 rows causes formatting inconsistencies. For task-level scheduling, use the Excel template for offline work or ClickUp for live dependency management.
You can view and edit the template in the Google Sheets mobile app, but the timeline visualization is difficult to read on small screens. The template is designed for desktop or tablet use, with a print layout optimized for landscape orientation.
Yes. Google Sheets supports simultaneous editing with real time cursor tracking. Each collaborator can update their own phase status. Use the Comments feature to tag specific team members for status update requests, and enable Notification settings to get alerts when the RAG status column changes.