Gantt Chart Templates
Choose a Format
Pick the tool you already work in. Each one opens a ready-to-use version of this template.
Most used
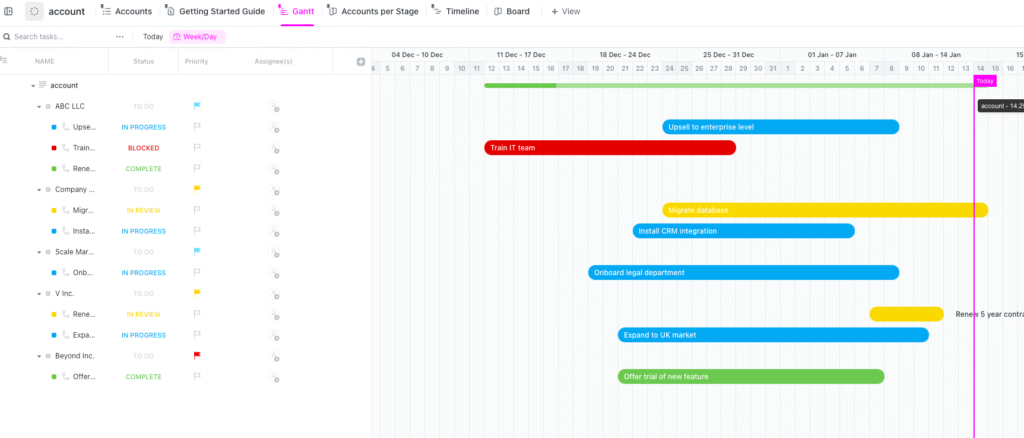
ClickUp
Best for Teams building live Gantt timelines in ClickUp
The Detailed Task Gantt framework built natively in ClickUp. Dependencies auto-link, the critical path updates in real time, and the schedule stays current when anyone changes a task.
Open ClickUp version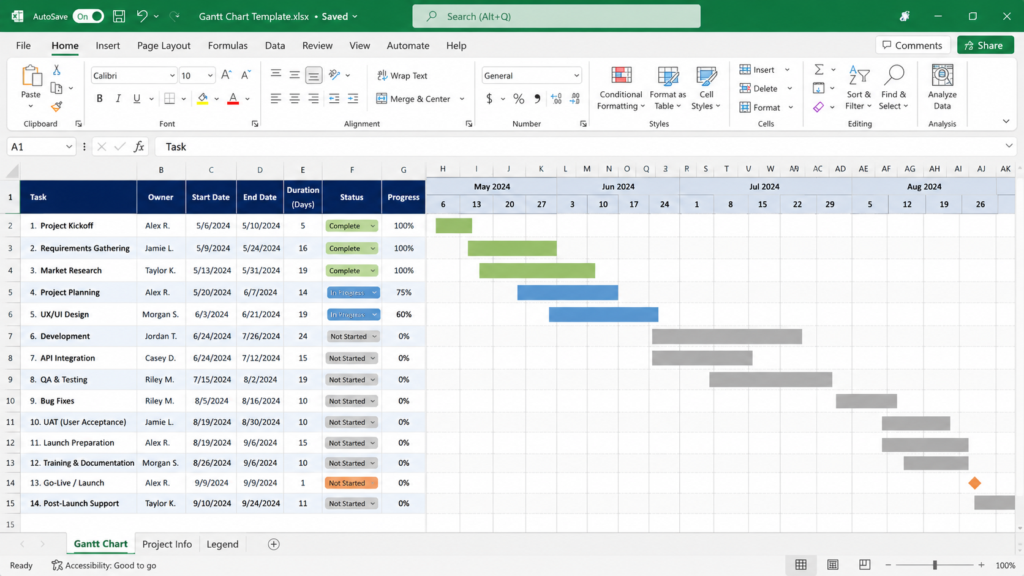
Excel
Best for Project managers building a Gantt in Excel
The Workload Gantt framework built in Excel with conditional formatting timeline bars, workload histogram rows, and predecessor tracking formulas for capacity planning.
Open Excel version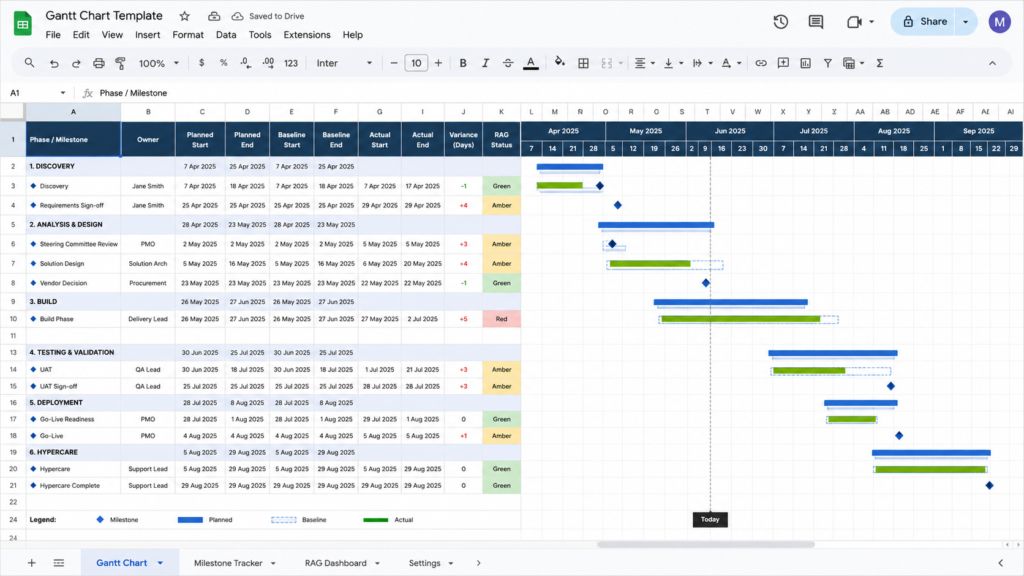
Google Sheets
Best for Teams sharing a Gantt in Google Sheets
The Milestone Gantt framework built in Google Sheets with phase gate tracking, RAG status indicators, and baseline comparison columns designed for executive reporting and steering committee updates.
Open Google Sheets versionHow to Choose the Right Gantt Framework
The Standard Timeline Gantt works for most projects. It handles the three things every schedule needs: task durations, dependency logic, and milestone visibility. If you are starting your first Gantt chart or managing a project under 50 tasks, start here.
Switch to the Resource Loaded Gantt when your team shares people across workstreams. The workload histogram catches overallocation that a standard timeline hides. A 10 person team running three concurrent projects will see conflicts weeks before they stall delivery.
The Summary Milestone Chart is not a planning tool. It is a communication tool. Use it when your audience is a steering committee, a client, or a VP who needs the schedule in 30 seconds, not 30 minutes. Build your real plan in one of the other two frameworks, then roll it up into the milestone view for reporting.
Combining Frameworks
Most teams of 15 or more end up using two: a Standard Timeline Gantt for the project team and a Summary Milestone Chart for stakeholders. The milestone chart pulls its dates from the detailed plan, so both stay in sync without double entry.
The Resource Loaded variant is worth the extra setup when your organization runs a PMO with shared resource pools. Individual project managers rarely need it, but portfolio managers who allocate people across 5 to 10 active projects will find it pays for itself in avoided conflicts.
Frequently Asked Questions
Open one of the templates above and replace the sample tasks with your own. In ClickUp, tasks automatically generate the Gantt bars. In Excel or Google Sheets, the templates use conditional formatting to draw bars from your start and end date columns. Either way, you have a working chart in under 10 minutes.
Yes, but manually. The Google Sheets template uses a predecessor column where you reference the row number of the upstream task. The conditional formatting then adjusts bar positions. It works for 20 to 30 tasks. Beyond that, a dedicated tool like ClickUp handles dependency logic without formula maintenance.
Keep it under 50 tasks for a single view. Beyond that, group tasks into phases and show summary bars at the phase level, with the ability to drill into detail when needed. The Milestone Gantt framework is specifically designed for this rolled up executive view.