Gantt Chart Template for Excel
The Workload Gantt framework built in Excel with conditional formatting timeline bars, workload histogram rows, and predecessor tracking formulas for capacity planning.
Gantt Chart Template for Excel
A downloadable Excel template that draws Gantt bars from conditional formatting, tracks resource workload with histograms, and manages task dependencies through predecessor formulas.
Free, ungated, opens in Excel
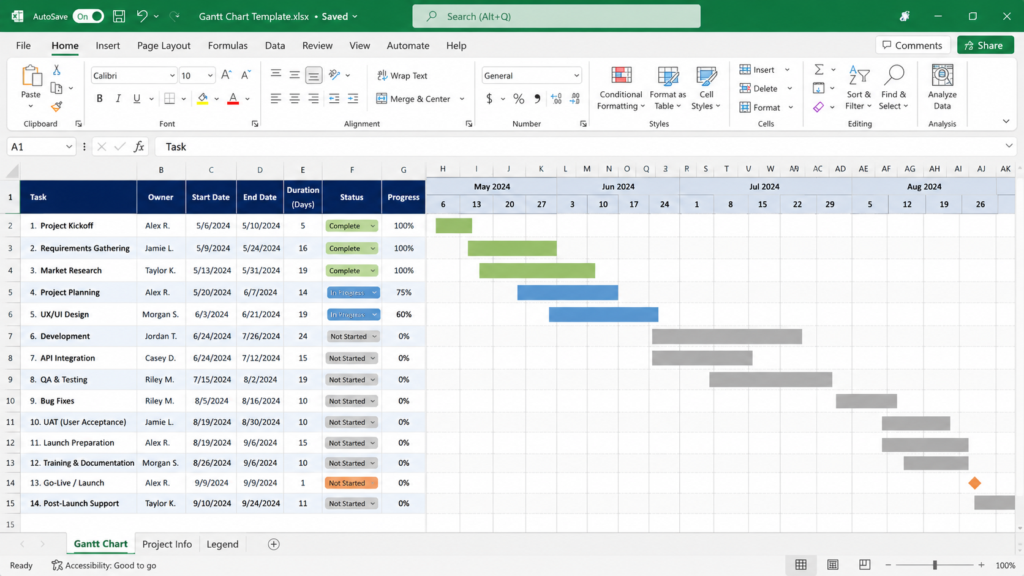
- Conditional formatting timeline bars driven by date formulas
- Predecessor column with multi-dependency support (comma-separated row references)
- Resource assignment dropdown per task from a reference sheet
- Workload histogram with automatic overallocation highlighting
- Phase summary bars with MIN/MAX rollup formulas
- RAG status column with data validation dropdowns
- Print-ready landscape layout for 11x17 paper
How to Use This in Excel
Download and Open the Template
Download the .xlsx file and open it in Excel 2016 or later. If prompted about macros, click Enable Content. The macros power the optional histogram refresh button on the Resources sheet. The core Gantt timeline works without macros enabled.
Enter Your Task Data
Replace the sample tasks in Column A with your own. Enter start dates in Column C and durations (in working days) in Column D. The End Date formula in Column E calculates automatically using the WORKDAY function. The conditional formatting draws the timeline bars as soon as dates are entered.
Set Task Predecessors
In Column F, enter the row number of each predecessor task. For multiple predecessors, separate row numbers with commas (e.g., “3,5”). The start date formula offsets based on the predecessor’s end date. If the predecessor column is empty, the task starts on its manually entered start date.
Assign Resources to Tasks
Select a resource from the dropdown in Column G. Resources are defined on the Resources sheet. Add new team members there to make them available in the dropdown. Each resource assignment feeds into the workload histogram calculation.
Review the Workload Histogram
Switch to the Resources sheet and click Refresh Histogram. The chart shows hours allocated per resource per day. Red cells indicate overallocation (more than 8 hours assigned on a single day). Rebalance assignments in the main Gantt sheet, then refresh again to verify.
Who This Is For
Teams in Microsoft 365 Organizations
Project managers in companies that standardize on Microsoft tools and prefer to keep project artifacts in SharePoint or Teams file channels.
Managers Tracking Resource Capacity
Team leads who need to see not just the timeline but also which team members are overloaded, without purchasing dedicated resource management software.
Offline Project Planners
Field teams, consultants, or professionals who need to update project schedules without reliable internet access. The full template works offline in desktop Excel.
Frequently Asked Questions
Yes. The conditional formatting and formulas work in Excel for Mac 2016 and later. The optional VBA histogram refresh requires enabling macros, which is supported in recent Mac versions. If your organization blocks macros, copy the SUMPRODUCT formula range manually to refresh the histogram.
You can import the .xlsx file into Google Sheets, but the conditional formatting rules will not transfer correctly. The predecessor formulas and the VBA histogram macro will also break. Use the Google Sheets template from this collection instead, which is built natively for Sheets.
The template works well up to about 75 tasks with the histogram enabled. Beyond that, conditional formatting recalculation slows noticeably when editing cells. For projects over 100 tasks, consider splitting into multiple phase sheets or moving to a dedicated project management tool.