
Gantt Chart Software for Report Developers
Streamline Your Reporting Projects with Precision Gantt Charts
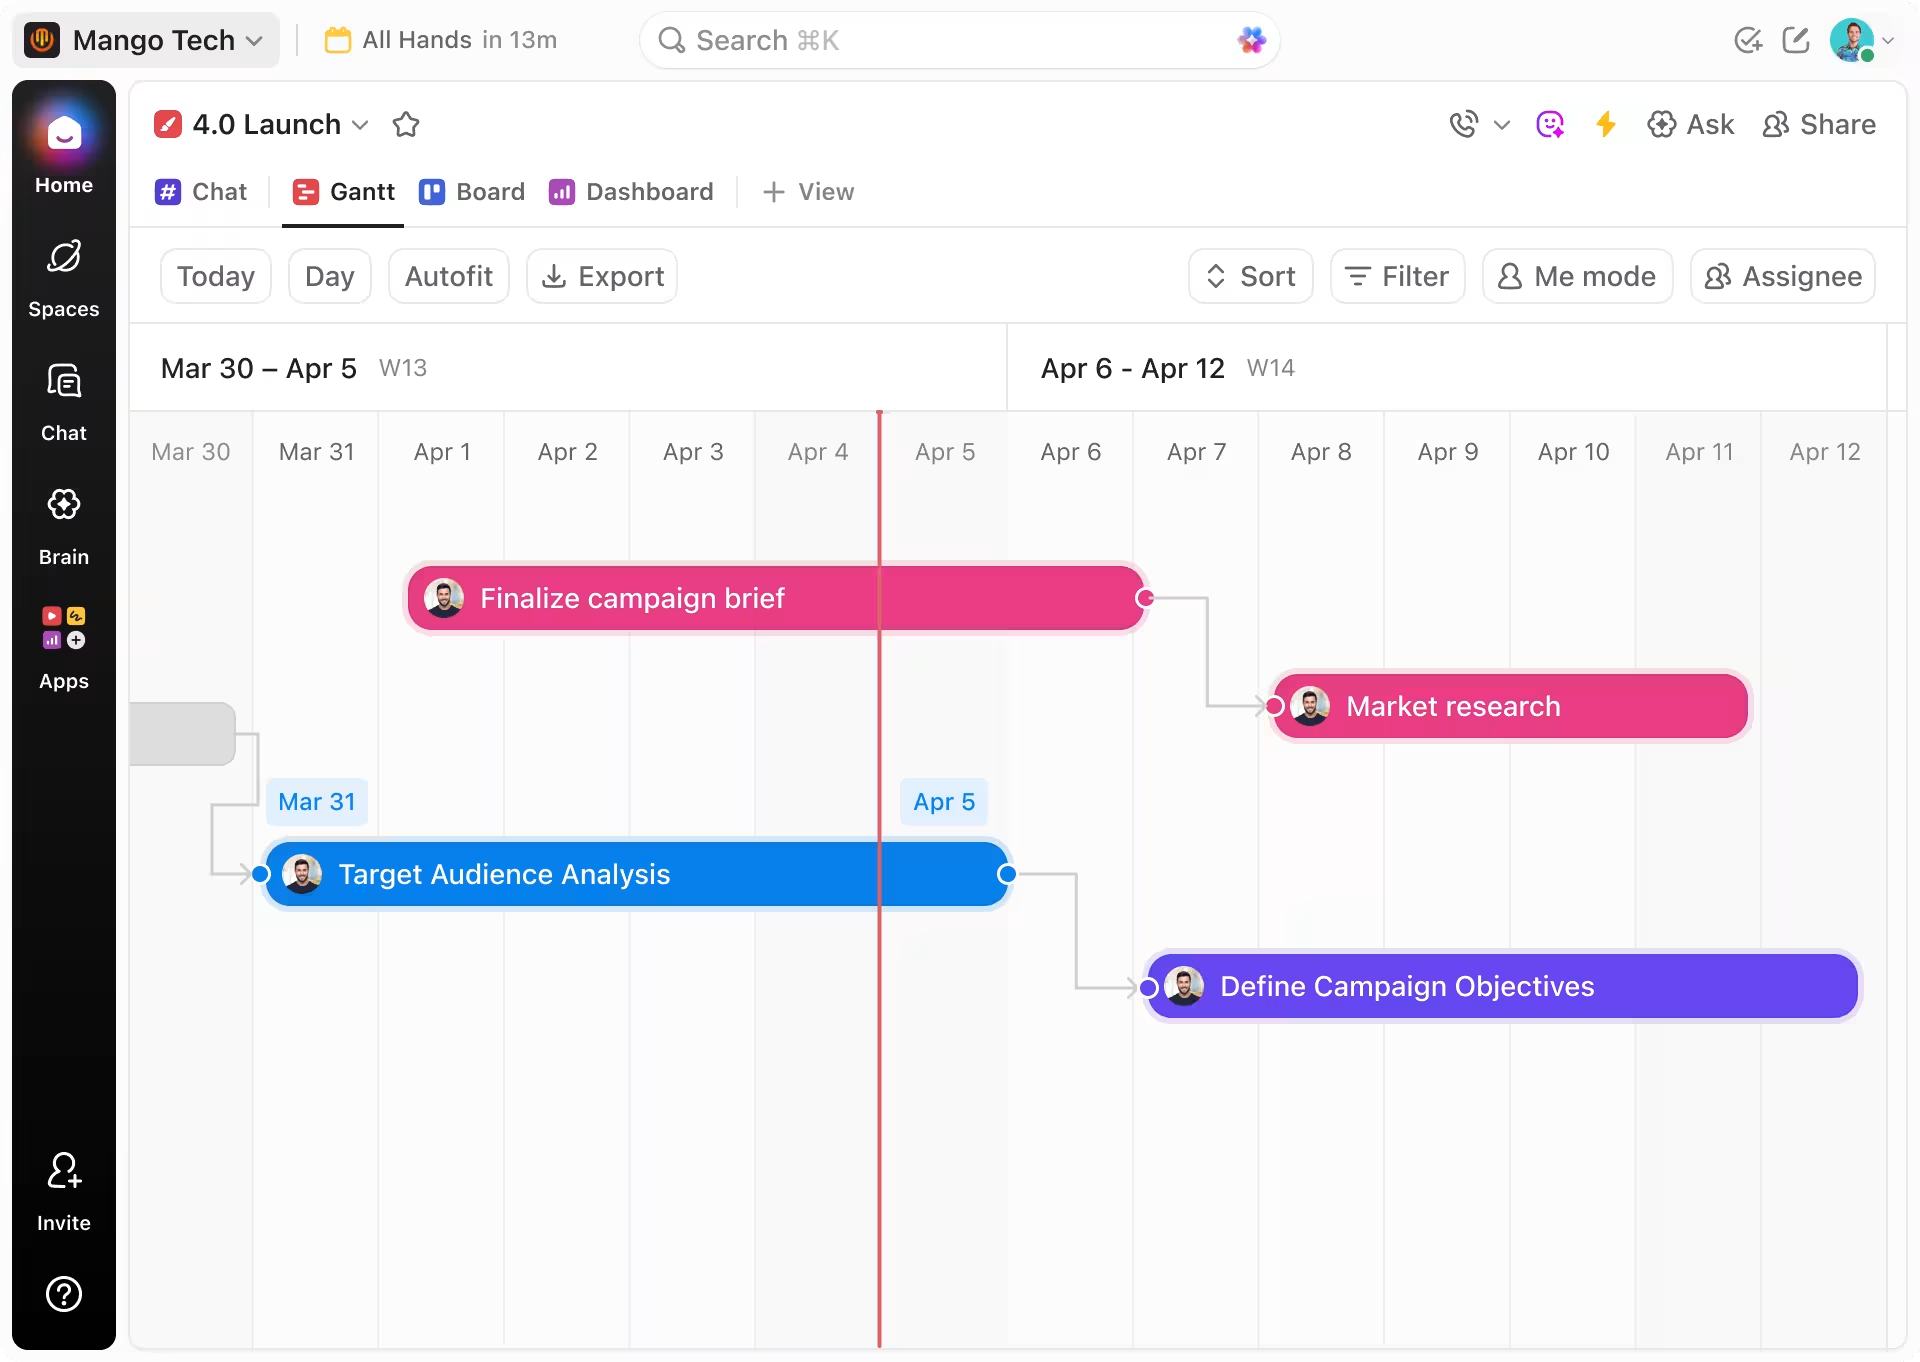
Visualize every phase of your report development—from data gathering to final delivery. Manage timelines spanning weeks or months, coordinate your team seamlessly, and keep your project workflow out of your head and onto a clear timeline.
 25,000+ reviews from
Trusted by the best
The Need for Timelines
Why Report Developers Benefit from Gantt Chart Software
Creating complex reports without a structured timeline often leads to missed deadlines and chaotic workflows. When schedules aren’t clear, priorities blur and collaboration suffers.
Here’s what typically goes wrong without a visual timeline for report development:
- Tasks overlap and cause bottlenecks — you lose sight of what’s pending or delayed.
- Data collection phases drag on — unclear ownership and progress hinder timely completion.
- Draft versions multiply uncontrollably — lack of coordination leads to confusion and rework.
- Feedback cycles become disorganized — comments get lost across emails and chats.
- Deadlines approach unnoticed — client submissions and internal reviews sneak up unexpectedly.
- Progress tracking feels opaque — months of effort seem stagnant without clear milestones.
- Communication splinters across platforms — causing misunderstandings and duplication.
- Resource allocation conflicts arise — software access, analyst time, and review slots overlap without planning.
Conventional vs ClickUp
Why Traditional Tools Fall Short Compared to ClickUp Gantt Charts
Discover how ClickUp’s Gantt view brings clarity and control to your report development process that fragmented tools can’t provide.
Conventional Approaches
- Scattered task lists and notes in multiple apps
- No unified timeline → duplicated efforts and missed dependencies
- Manual tracking of data gathering and analysis steps → prone to errors
- Confusing version control and unclear reviewer roles
- Last-minute deadline surprises
- Files and feedback spread across drives and emails
ClickUp Gantt Charts
- Consolidated tasks and timelines in one interactive view
- Visualize data collection, drafting, and review stages with clear deadlines
- Automate dependencies and milestone tracking to reduce errors
- Assign reviewers and collaborators with defined responsibilities
- Receive automated alerts for upcoming deadlines
- Attach files and feedback directly to tasks for easy access
Use Cases
How Gantt Chart Software Empowers Report Developers
Explore how a visual timeline eliminates confusion and keeps your reporting projects on schedule.
#UseCase1
Eliminating Scheduling Blind Spots in Complex Reports
ClickUp’s Gantt charts extract your project timelines into a clear visual map—making bottlenecks visible and progress trackable.
#UseCase2
Creating Transparent Revision Histories
Map every draft and revision on a timeline that stakeholders can follow to ensure alignment and accountability.
#UseCase3
Tracking Client Feedback with Organized Timelines
Update deadlines, dependencies, and priorities dynamically to reflect client input and keep your team informed.
#UseCase4
Preventing Data Analysis Delays Through Task Sequencing
Define dependencies to ensure data collection and analysis steps happen in the correct order without overlap.
#UseCase5
Managing Review Cycles Efficiently
Visualize approval stages, assign reviewers, and set reminders to keep the review process on track.
#UseCase6
Coordinating Multi-Team Contributions
Use Gantt views to synchronize inputs from analysts, writers, and designers, preventing conflicts and delays.
#UseCase7
Meeting Critical Reporting Deadlines
Plan submission milestones — drafts, final reports, presentations — to ensure timely delivery to clients and stakeholders.
#UseCase8
Avoiding Redundant Work with Clear Task Ownership
Assign responsibilities clearly on the timeline to minimize duplicated efforts and miscommunication.
#UseCase9
Transforming Meetings into Actionable Project Steps
Convert discussion points into timeline tasks with owners and deadlines, so nothing falls through the cracks.
Key Beneficiaries
Who Gains the Most from ClickUp Gantt Charts in Reporting
Ideal for report developers managing multiple projects, collaborators, or tight deadlines in data-driven environments.
For Analysts in Multi-Departmental Teams
ClickUp aligns workflows across teams and time zones, keeping everyone synchronized on project phases.

For Data Scientists Managing Complex Pipelines
ClickUp sequences analysis tasks, manages resource availability, and prevents overlaps to maintain data integrity.

For Junior Report Developers and Interns
ClickUp provides clear milestones for learning, task ownership, and progress tracking on every report.

How ClickUp Supports Report Developers
How ClickUp Gantt Charts Enhance Report Development
Master your reporting workflow with ClickUp’s visual timeline capabilities
Centralize All Reporting Materials
Link data sources, analysis files, drafts, and feedback directly to timeline tasks for easy access.
Plan Reports in Logical Phases
Outline data collection, drafting, reviews, and finalization for end-to-end project transparency.
Standardize Reporting Workflows
Utilize templates and dependencies to ensure consistency and reduce errors across reports.
Visualize Team Collaboration Effortlessly
Assign clear responsibilities, track progress, and coordinate parallel tasks across your team.
Turn Meetings into Clear Action Plans
Convert client and team discussions into sequenced tasks on your Gantt timeline.
Never Miss a Critical Deadline
Automated alerts and timeline overviews help you stay ahead of client submissions and internal reviews.

FAQs About Gantt Chart Software for Report Developers


SOC 2
CERTIFIED

ISO 27001
CERTIFIED

GDPR
COMPLIANT

HIPAA
COMPLIANT