
Gantt Chart Tailored for Oceanographers
Navigate Your Ocean Research Projects with Precision
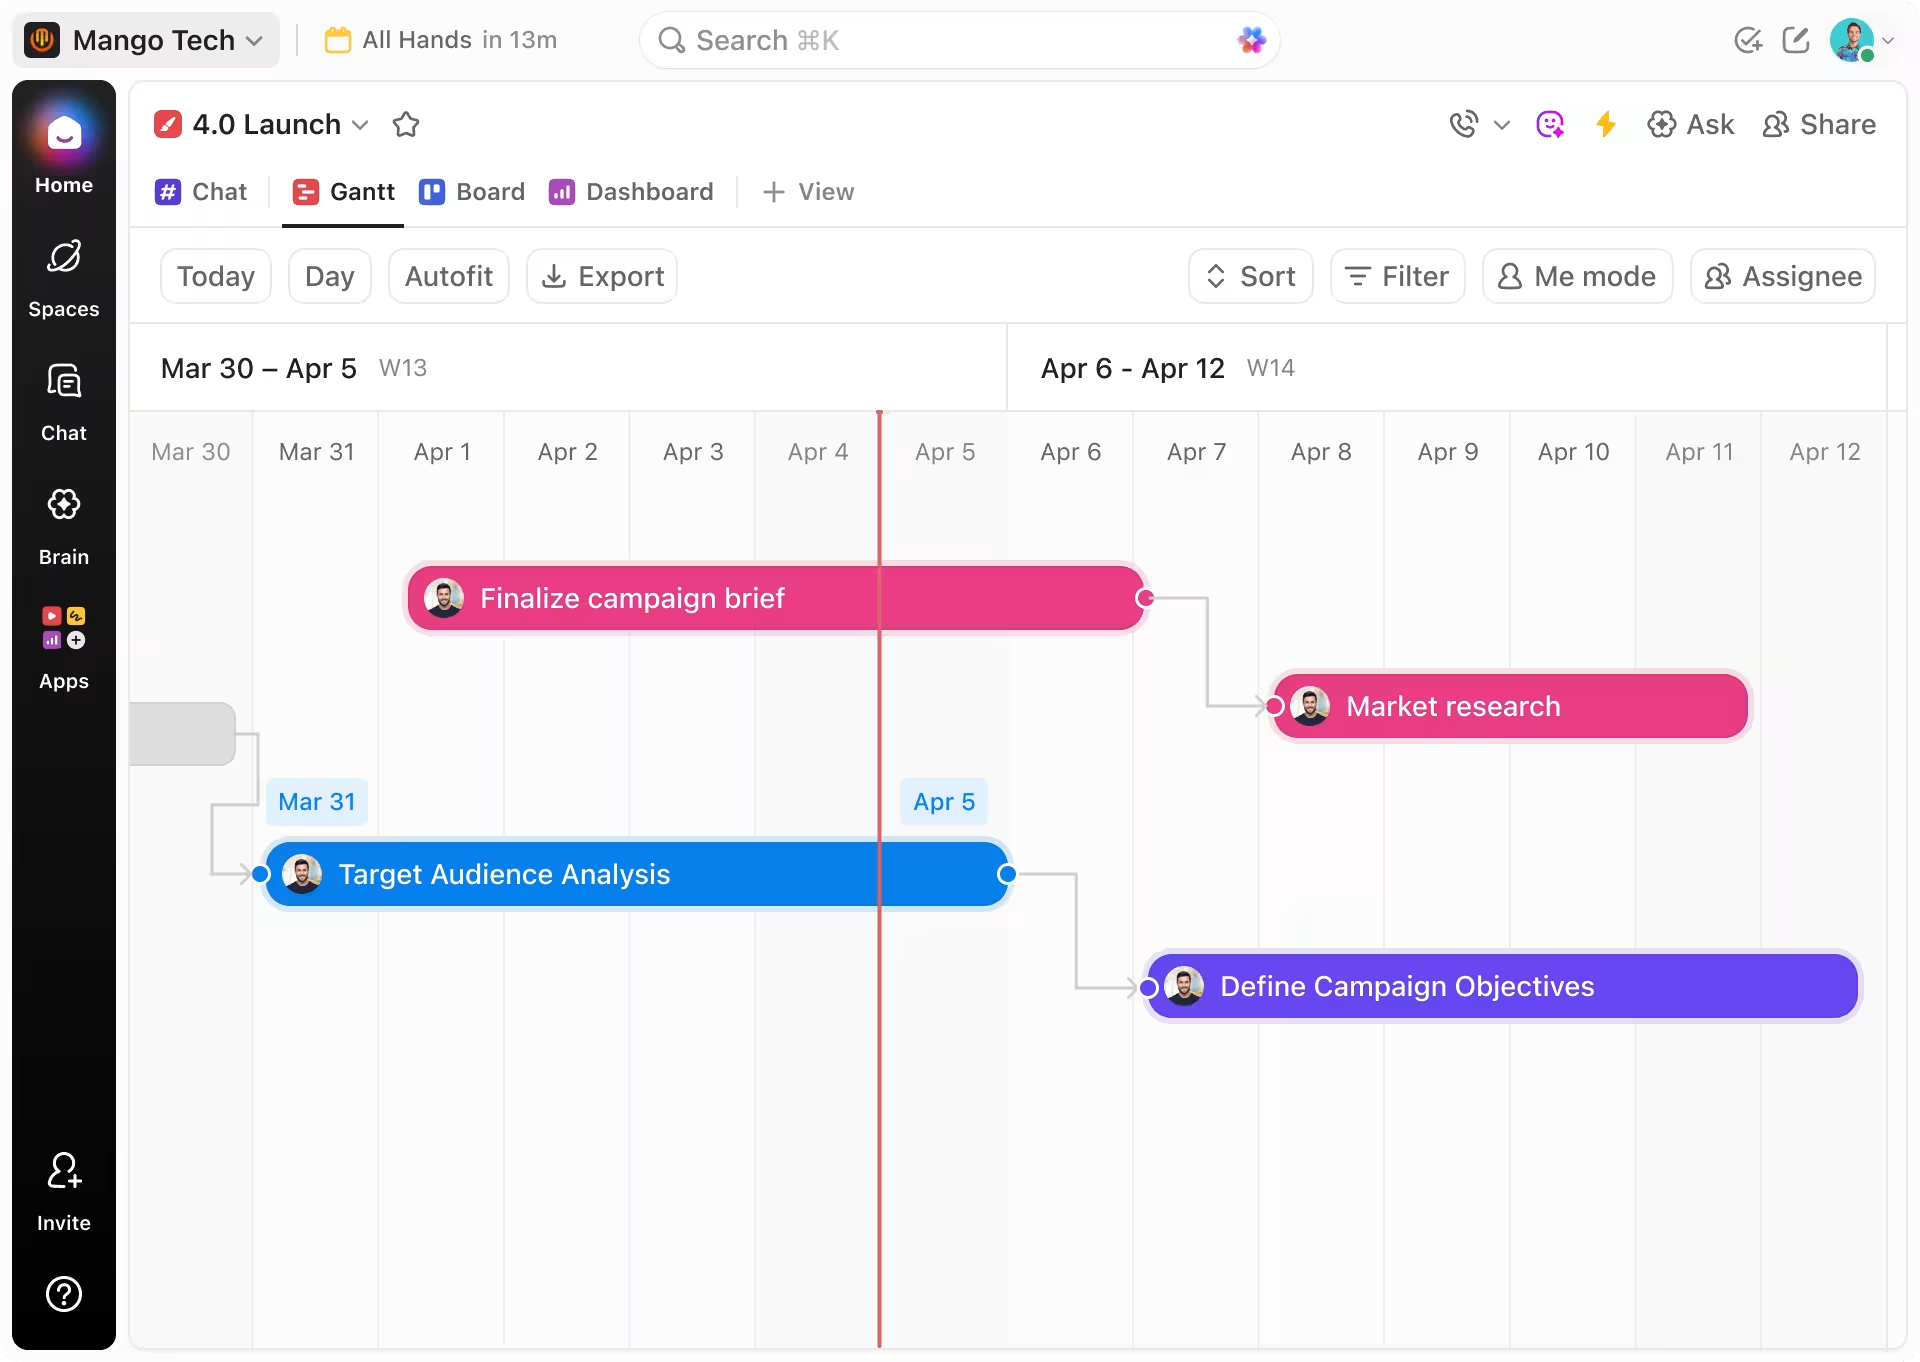
Chart your projects from initial survey to final report, track timelines across seasons, coordinate teams, and visualize workflows beyond mental maps.
 25,000+ reviews from
Trusted by the best
Why Gantt Chart
Why Oceanographers Benefit from Gantt Chart Software
Managing oceanographic research without a clear timeline invites disorder. Tasks merge, priorities clash, and deadlines sneak up unexpectedly.
Common pitfalls oceanographers face without timeline management include:
- Extended expeditions lose clarity — it becomes tough to track completed surveys versus upcoming fieldwork.
- Data processing workflows lack coordination — inconsistent sequencing causes analysis delays.
- Collaborative efforts become fragmented — unclear task ownership slows down multi-institutional projects.
- Regulatory and permit deadlines get overlooked — risking compliance issues.
- Progress tracking is difficult — months of sampling can feel stagnant without visible milestones.
- Communication scatters across tools — emails, logs, and spreadsheets create confusion.
- Resource allocation conflicts emerge — vessel schedules and equipment availability overlap without a timeline.
Traditional vs ClickUp
Why Conventional Methods Fall Short for Oceanographers
Discover how ClickUp Gantt Charts unify your oceanographic project management where traditional tools fragment.
Conventional Approaches
- Data and schedules scattered in spreadsheets, emails, and notebooks
- No integrated timeline → missed survey phases
- Manual tracking of sample collection → prone to errors
- Collaboration hampered by unclear task assignments
- Permit and funding deadlines easily missed
- Files and reports dispersed across platforms
ClickUp Gantt Charts
- Unified task and timeline visualization
- Schedule fieldwork, lab analysis, and reporting with deadlines
- Manage dependencies to maintain sequence integrity
- Assign roles with clear deadlines and responsibilities
- Automated reminders for permits and submissions
- Directly link datasets and documents to tasks
Use Cases
Leveraging Gantt Chart Software for Oceanographic Research
Explore how timeline visualization reduces uncertainty and accelerates ocean science projects.
#UseCase1
Visualizing Complex Expedition Timelines
ClickUp’s Gantt charts transform extended ocean expeditions into clear, manageable schedules—eliminating bottlenecks and clarifying progress.
#UseCase2
Documenting Data Collection and Analysis Steps
Map every sampling event and analysis phase in a transparent timeline that collaborators and stakeholders can easily follow.
#UseCase3
Tracking Regulatory Compliance and Permitting
Keep all permits and environmental regulations on your radar with automated reminders and visible deadlines.
#UseCase4
Ensuring Proper Sequence in Sample Processing
Define dependencies between sampling, lab work, and data interpretation to maintain scientific rigor and consistency.
#UseCase5
Coordinating Multi-Institutional Oceanographic Teams
Synchronize diverse teams across vessels, labs, and universities with a shared timeline and task assignments.
#UseCase6
Managing Equipment and Vessel Scheduling
Avoid conflicts by scheduling resource use clearly within the project timeline, ensuring smooth operations.
#UseCase7
Meeting Publication and Grant Deadlines
Visualize every step from manuscript drafting to submission, so deadlines are never missed.
#UseCase8
Organizing Literature and Data Reviews
Assign papers and datasets on a timeline to prevent overlap and track review progress efficiently.
#UseCase9
Transforming Team Meetings into Actionable Schedules
Convert discussion points into sequenced tasks with owners to guarantee follow-through.
Beneficiaries
Who Gains the Most from ClickUp Gantt in Oceanography
Ideal for anyone managing complex timelines, diverse teams, or regulatory demands in ocean science.
If you coordinate multi-vessel or multinational expeditions
ClickUp syncs workflows across oceans and time zones so your teams stay connected and aligned.

If you lead lab-based oceanographic analyses
ClickUp sequences sample processing, tracks equipment use, and prevents scheduling conflicts.

If you’re a graduate student or postdoc in ocean sciences
Plan fieldwork, data analysis, and thesis milestones clearly on a timeline designed for your research demands.

How ClickUp Supports Oceanographic Research
Streamline Your Ocean Science Workflow with ClickUp Gantt
Navigate every step of your ocean research with clarity and control.
Centralize All Research Elements
Link datasets, equipment logs, field notes, and reports directly to tasks within a visual timeline.
Plan Expeditions and Analyses End-to-End
Outline surveys, lab work, and reporting phases for complete project visibility.
Standardize Protocols and Procedures
Use templates, dependencies, and scheduled steps to ensure consistent and reproducible results.
Visualize Team Roles and Progress
Assign responsibilities with deadlines, track progress, and coordinate parallel work streams efficiently.
Turn Meetings into Scheduled Actions
Transform discussions into sequenced tasks on your Gantt chart—nothing gets lost between meetings.
Stay Ahead of Deadlines
Monitor permits, grant submissions, and manuscript deadlines with automated alerts and timeline visibility.

FAQs on Gantt Chart Software for Oceanography


SOC 2
CERTIFIED

ISO 27001
CERTIFIED

GDPR
COMPLIANT

HIPAA
COMPLIANT