
Gantt Chart for Mobile Performance Experts
Transform Mobile Performance Monitoring with ClickUp Gantt
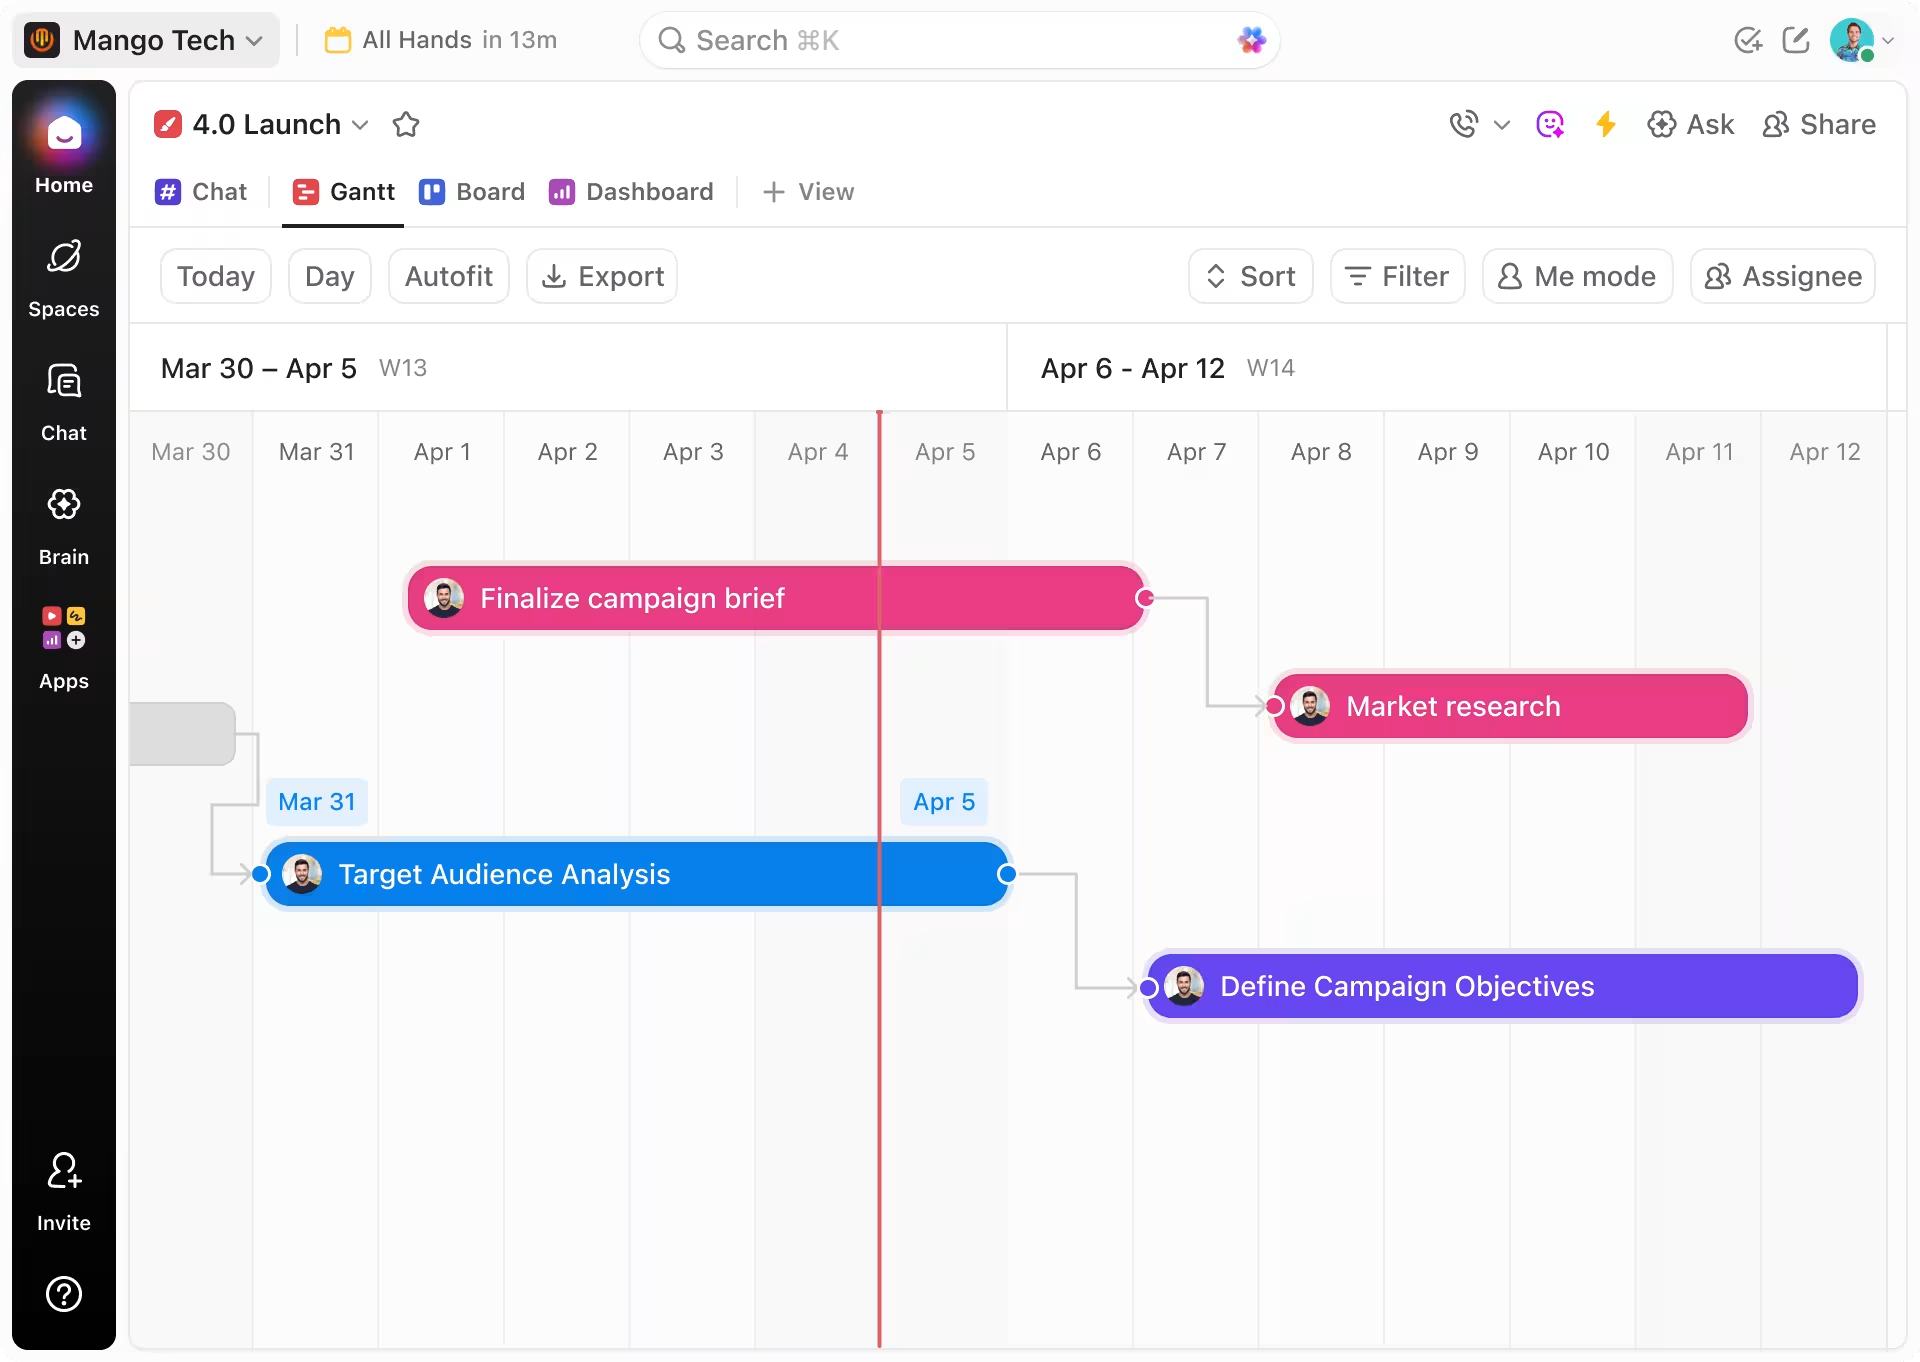
Visualize your mobile project timelines, track performance metrics in real-time, coordinate your team, and manage milestones with a dynamic workflow that keeps you ahead of the curve.
 25,000+ reviews from
Trusted by the best
Why Choose Gantt Charts
Elevate Mobile Performance Management with Gantt Charts
Monitoring mobile performance without a clear timeline creates chaos—delays, missed issues, and unclear priorities derail success.
Here’s what challenges arise without a structured timeline:
- Performance bottlenecks remain hidden — you lose visibility into when and where issues occur.
- Testing cycles overlap or repeat — inefficient scheduling causes wasted resources.
- Feature rollouts lack coordination — dependencies between releases and fixes get missed.
- Team collaboration is fragmented — unclear task ownership slows resolution.
- Deadlines for updates and patches slip by — leaving users frustrated.
- Data from multiple tools stays disconnected — making insights hard to compile.
- Resource allocation conflicts emerge — causing delays in critical monitoring phases.
Traditional Methods vs ClickUp Advantage
Why Legacy Tracking Can't Match ClickUp Gantt for Mobile Monitoring
Discover how ClickUp Gantt Charts offer a clear, centralized timeline that traditional methods fail to deliver.
Conventional Monitoring Approaches
- Data scattered across spreadsheets, emails, and standalone apps
- No unified view of testing and deployment timelines
- Manual tracking leads to missed dependencies
- Poor visibility into team responsibilities
- Reactive issue resolution after delays
- Fragmented reporting across platforms
Use Cases
Unlock Powerful Mobile Performance Monitoring with Gantt Charts
See how visual timelines eradicate confusion and accelerate mobile project success.
#UseCase1
Visualizing Performance Trends Over Time
ClickUp’s Gantt charts display key performance indicators on a timeline—making it easy to spot degradation patterns or improvements.
#UseCase2
Coordinating Cross-Functional Testing Cycles
Map testing phases with dependencies, ensuring QA, dev, and deployment teams stay synchronized and efficient.
#UseCase3
Managing Feature Release Schedules
Plan rollout timelines with clear milestones and dependencies, minimizing conflicts and user impact.
#UseCase4
Tracking Bug Fixes and Patch Deployments
Link issue resolution tasks to specific timeline points for transparent progress and accountability.
#UseCase5
Optimizing Resource Allocation
Visualize team workloads and tool availability to avoid bottlenecks and maximize productivity.
#UseCase6
Integrating Performance Data and Alerts
Attach performance logs and automatic alerts directly to tasks to centralize monitoring and rapid response.
#UseCase7
Meeting Deadlines for App Store Updates
Gantt charts help you schedule submission, review, and release milestones to ensure timely app updates.
#UseCase8
Streamlining Communication Across Teams
Keep everyone aligned with a shared timeline and clear task assignments, reducing miscommunication.
#UseCase9
Enhancing Post-Launch Performance Tracking
Track ongoing performance monitoring and user feedback loops seamlessly within your project timeline.
Key Beneficiaries
Who Benefits Most from ClickUp Gantt in Mobile Monitoring?
Ideal for teams juggling complex mobile projects, tight deadlines, and dynamic performance goals.
If you manage Distributed Mobile Development Teams
ClickUp keeps workflows transparent across locations and time zones, ensuring synchronized performance monitoring and swift issue resolution.

If you’re a Mobile QA Engineer
Sequence testing phases, track defect resolutions, and manage device resource availability without overlap or delay.

If you’re a Product Manager
Plan feature rollouts, monitor performance impact, and align cross-team efforts around clear, actionable timelines.

How ClickUp Enables Success
Simplify Mobile Performance Monitoring with ClickUp Gantt
Optimize every stage of your mobile projects with ClickUp’s intelligent Gantt capabilities
Centralize All Performance Data
Link logs, test results, and user feedback directly to timeline tasks for immediate access.
Visualize End-to-End Project Flow
Map every development, testing, and deployment phase for complete clarity.
Automate Task Dependencies
Set task sequences and triggers to prevent errors and delays in your monitoring process.
Enhance Team Collaboration
Assign roles, track progress, and coordinate efforts with real-time updates.
Convert Meetings into Action Plans
Turn discussions into scheduled tasks with deadlines to maintain momentum.
Stay Ahead of Deadlines
Receive automated alerts for critical updates, releases, and monitoring milestones.

FAQs on Gantt Chart Software for Mobile Performance Monitoring


SOC 2
CERTIFIED

ISO 27001
CERTIFIED

GDPR
COMPLIANT

HIPAA
COMPLIANT