
Gantt Chart for Human Factors Engineers
Organize Your Human Factors Projects with Precision
Visualize every research phase, manage timelines spanning weeks or months, coordinate team efforts, and gain a clear workflow that goes beyond mental notes.
 25,000+ reviews from
Trusted by the best
Why Choose Gantt Charts
Why Human Factors Engineers Rely on Gantt Chart Software
Managing human factors projects without a structured timeline leads to scattered efforts and missed dependencies.
Common challenges without a visual timeline include:
- Extended project phases become ambiguous — it's hard to track what’s pending, ongoing, or delayed.
- User research tasks overlap — unclear assignments cause duplicated efforts and missed insights.
- Testing and evaluation sequences get jumbled — leading to inconsistent data and repeated tests.
- Collaboration hurdles arise — unclear responsibilities and version confusion slow progress.
- Critical deadlines for usability studies and reports sneak up — risking compliance and delivery.
- Progress monitoring is ineffective — without visible milestones, momentum stalls.
- Disjointed communication across platforms — emails, chats, and documents scatter vital information.
- Resource scheduling conflicts — lab equipment and participant availability overlap without proper planning.
Traditional vs ClickUp
Why Conventional Methods Fall Short for Human Factors Engineers
Discover how ClickUp’s Gantt Charts provide a comprehensive view that traditional tools can’t match.
Traditional Approaches
- Information fragmented across emails, notes, and spreadsheets
- No clear scheduling for user testing → redundant sessions
- Manual tracking of task dependencies → prone to errors
- Role confusion in team collaboration
- Deadlines for reports and studies often missed
- Disorganized storage of files and feedback
ClickUp Gantt Charts
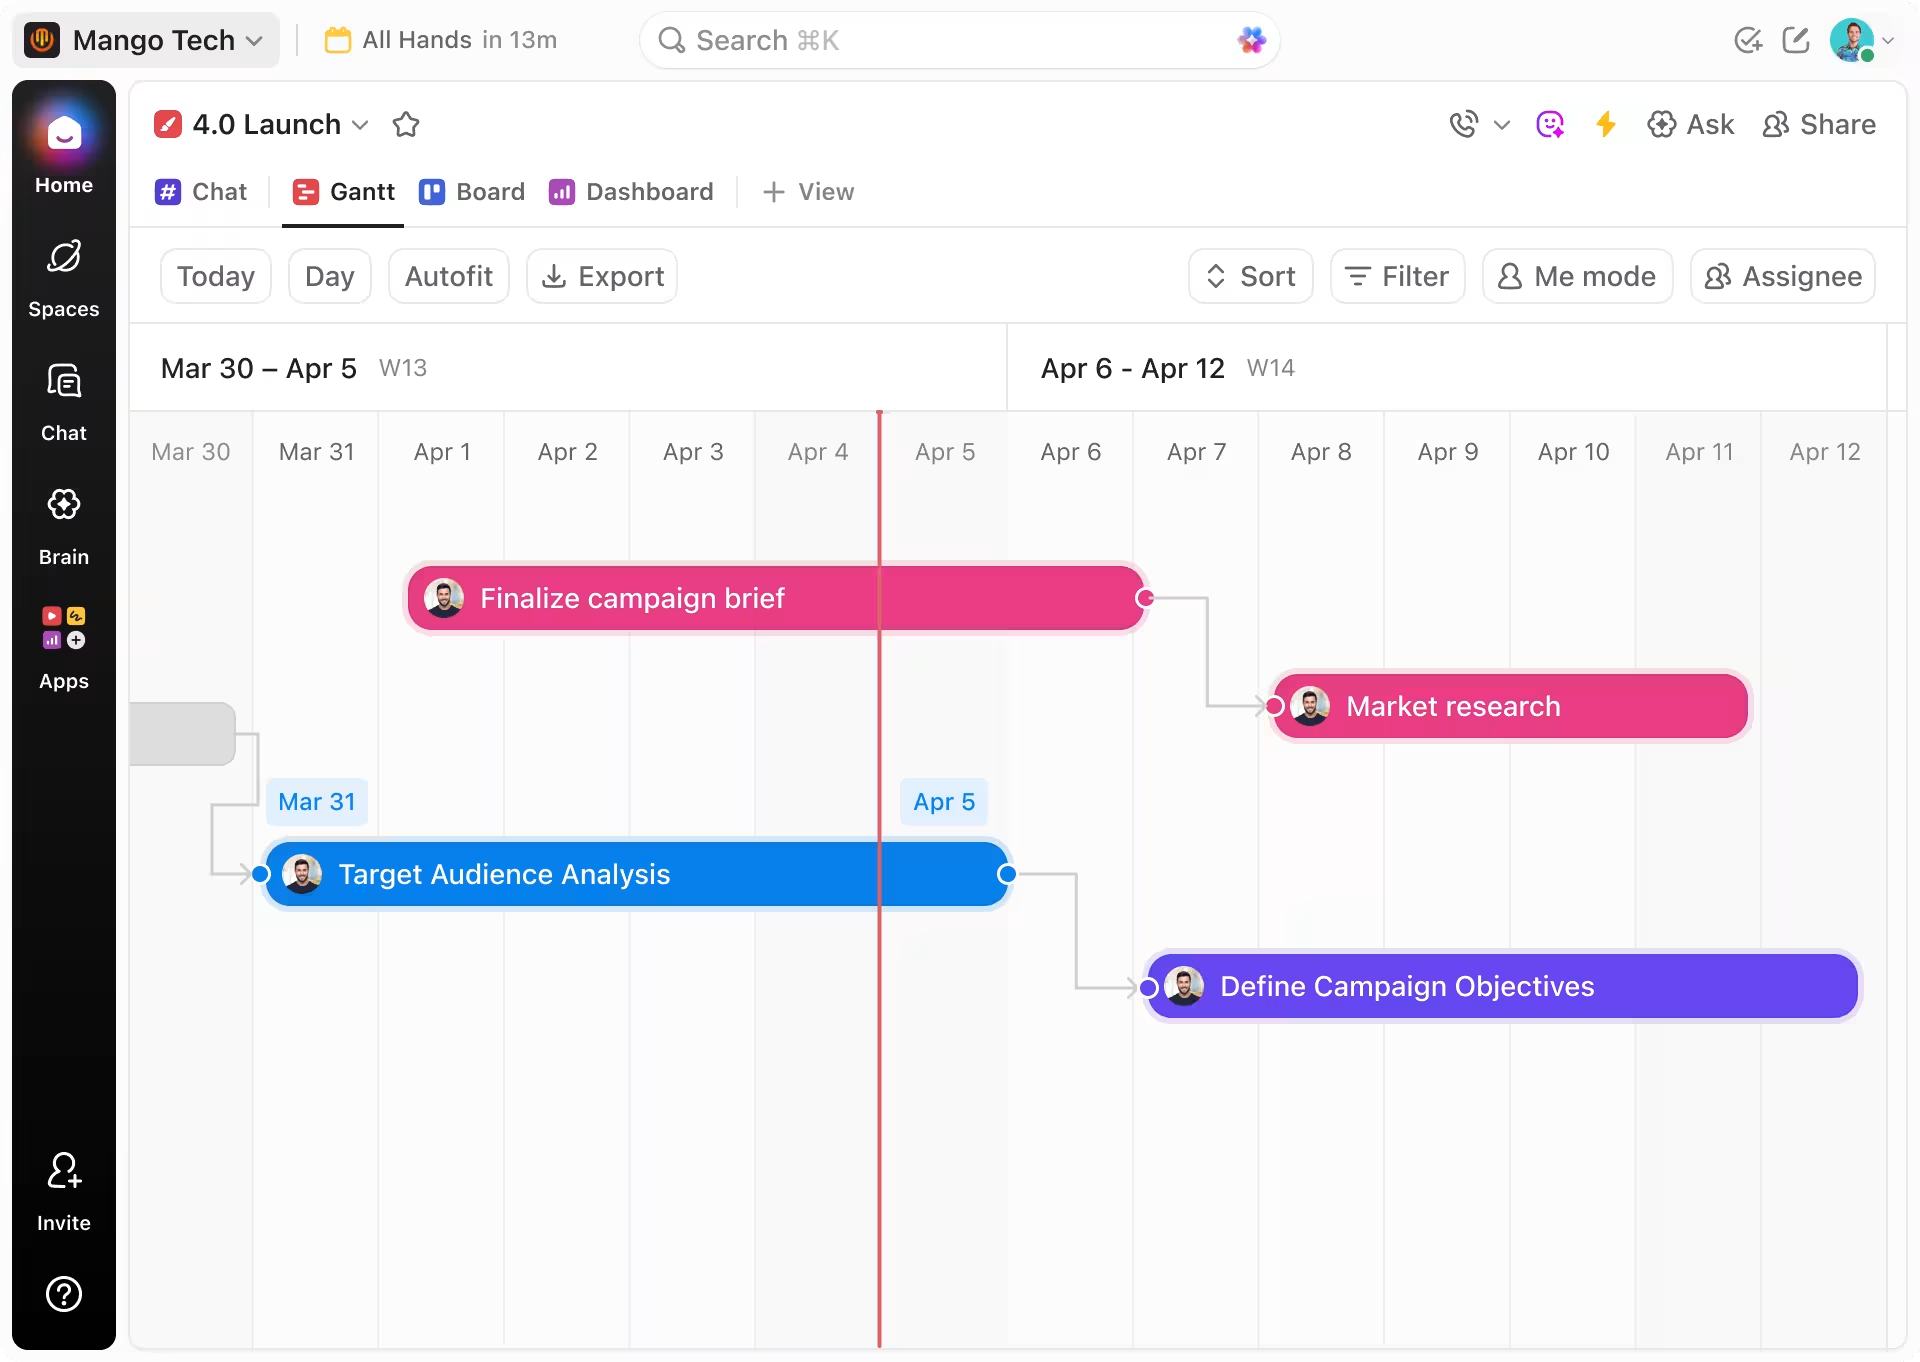
- Unified tasks and timelines in one interactive view
- Schedule user research phases with clear start and end dates
- Visual dependency tracking to maintain correct task order
- Assign clear ownership and deadlines
- Automated alerts to stay ahead of milestones
- Attach study materials and feedback directly to tasks
Use Cases
Unlock the Full Potential of Gantt Chart Software for Human Factors Engineering
Leverage visual timelines to eliminate bottlenecks and enhance project clarity.
#UseCase1
Eliminating Uncertainty in Extended Project Phases
ClickUp’s Gantt charts translate complex project stages into clear visuals—so delays are spotted early and resolved effectively.
#UseCase2
Creating Transparent Documentation Trails
Map every usability test and user feedback session in a timeline that stakeholders and teams can easily follow.
#UseCase3
Tracking Iterative Design Feedback Efficiently
Update task timelines and dependencies as design feedback evolves—keeping all changes visible and organized.
#UseCase4
Preventing Testing Inconsistencies with Sequenced Tasks
Ensure usability tests and evaluations proceed in the correct order with dependency mapping for reliable results.
#UseCase5
Managing Compliance and Ethical Review Processes
Track IRB approvals and ethical milestones within your project timeline to avoid overlooked requirements.
#UseCase6
Coordinating Complex Data Collection Pipelines
Visualize how each data collection and analysis step affects the next, ensuring smooth workflow transitions.
#UseCase7
Avoiding Missed Deadlines for Reports and Presentations
Plan every deliverable from initial findings to final reports—ensuring timely submission and stakeholder alignment.
#UseCase8
Organizing User Research Tasks Without Overlap
Assign user study components clearly, sequence participant sessions, and monitor progress on a unified timeline.
#UseCase9
Turning Stakeholder Meetings into Actionable Timelines
Convert discussion points into scheduled tasks with owners, so next steps are tracked and completed.
Key Beneficiaries
Who Benefits Most from ClickUp Gantt Chart Software in Human Factors Engineering
Designed for professionals managing complex timelines, interdisciplinary teams, and critical deadlines in human factors work.
If You Lead Multi-Disciplinary Teams Across Locations
ClickUp synchronizes workflows across departments and time zones to keep everyone aligned and informed.

If You Conduct Lab-Based Usability Testing
Easily coordinate testing schedules, resource allocation, and participant recruitment with timeline accuracy.

If You’re a Human Factors Researcher or Analyst
Plan research phases, data collection, analysis, and reporting milestones clearly and efficiently.

How ClickUp Supports Your Work
Simplify Human Factors Engineering with ClickUp Gantt Charts
Achieve seamless project flow and clear visibility into every task
Centralize Project Documentation
Attach protocols, test scripts, participant data, and feedback directly to tasks in your timeline.
Phase Your Projects Clearly
Break down research, testing, analysis, and reporting into manageable, visible stages.
Ensure Consistency with Templates
Use repeatable workflows and dependencies to maintain quality and reduce errors across projects.
Visualize Teamwork in Real Time
Assign clear roles, set deadlines, and track progress to coordinate team efforts effectively.
Convert Meetings into Clear Actions
Turn discussions into scheduled tasks with assigned owners right on your Gantt chart.
Stay Ahead of Deadlines
Set automated reminders for critical submissions, reviews, and approvals to keep projects on track.

FAQs on Gantt Chart Software for Human Factors Engineers


SOC 2
CERTIFIED

ISO 27001
CERTIFIED

GDPR
COMPLIANT

HIPAA
COMPLIANT