
Gantt Chart for Asset Management Firms
Visualize Asset Management Projects with Precision
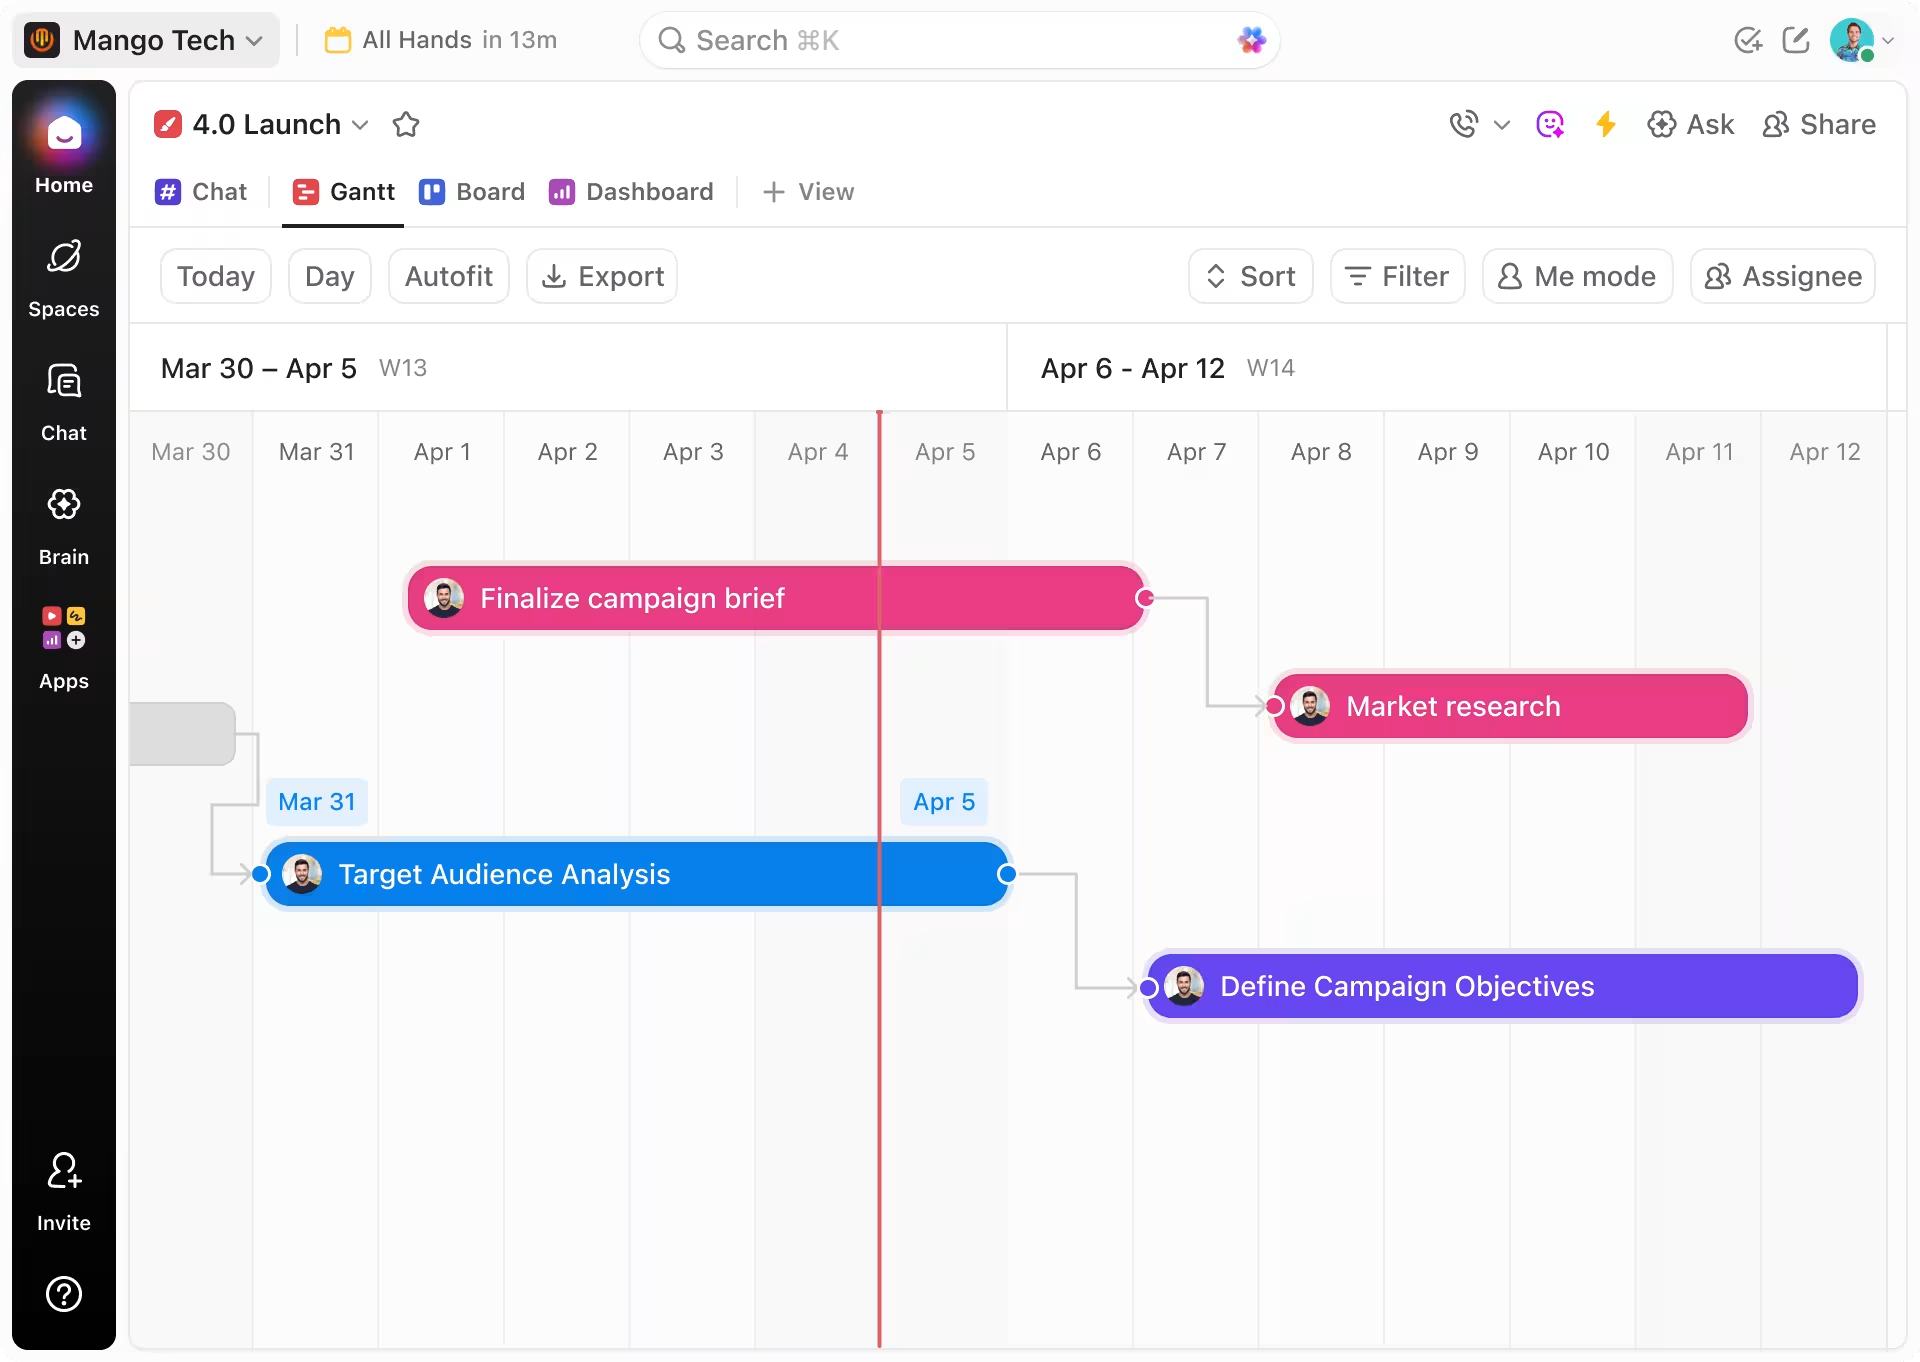
Organize your asset portfolios, track project milestones over months or years, coordinate teams effortlessly, and gain a clear visual workflow beyond spreadsheets and emails.
 25,000+ reviews from
Trusted by the best
The Power of Visual Timelines
Why Asset Managers Rely on Gantt Chart Software
Managing assets without a clear timeline is like navigating a maze blindfolded. Tasks pile up, deadlines blur, and risks multiply.
Here’s what often goes wrong without a dynamic timeline:
- Complex project phases become confusing — losing sight of acquisition, due diligence, and disposition stages.
- Resource allocation falters — overlapping team efforts and missed opportunities.
- Compliance deadlines slip through cracks — regulatory submissions and reports become last-minute scrambles.
- Communication breakdowns increase — critical updates scattered across emails and spreadsheets.
- Progress tracking is opaque — making it hard to report status to stakeholders.
- Risk assessment timelines get overlooked — leading to delayed mitigations and potential losses.
- Collaboration across departments is inconsistent — causing duplication or gaps.
- Forecasting and budgeting suffer — without clear project sequencing and dependencies.
Traditional vs ClickUp
Why Manual Methods Fall Short for Asset Management Teams
Discover how ClickUp Gantt Charts deliver transparency and control where spreadsheets and emails can’t.
Traditional Approaches
- Data scattered across spreadsheets, emails, and calendars
- No unified view of project timelines and dependencies
- Resource conflicts and missed handoffs
- Compliance deadlines tracked manually, prone to errors
- Limited visibility into project progress
- Difficult collaboration across teams and departments
ClickUp Gantt Charts
- Integrated timeline with tasks, milestones, and dependencies
- Real-time updates and automated reminders
- Clear resource allocation and conflict alerts
- Compliance and reporting deadlines tracked and visible
- Centralized documents and communications linked to tasks
- Enhanced cross-team collaboration and accountability
Use Cases
How Gantt Chart Software Empowers Asset Management Firms
Explore how visual timelines transform asset management workflows and decision-making.
#UseCase1
Eliminating Project Timeline Uncertainty
ClickUp’s Gantt charts bring clarity to complex asset acquisition and disposition timelines—helping you anticipate bottlenecks and accelerate approvals.
#UseCase2
Enhancing Compliance Tracking and Reporting
Map regulatory deadlines and mandatory reports on a clear timeline, ensuring nothing falls through the cracks during audits.
#UseCase3
Coordinating Cross-Department Collaboration
Visualize task ownership and dependencies across legal, finance, and operations teams to streamline execution.
#UseCase4
Optimizing Resource Allocation and Scheduling
Assign teams and budgets with timeline visibility to prevent overlaps and maximize efficiency.
#UseCase5
Managing Risk Assessments Sequentially
Track risk evaluation stages with dependencies to ensure thorough and timely mitigations.
#UseCase6
Tracking Investment Performance Milestones
Set and monitor key performance dates and deliverables to keep assets aligned with strategic goals.
#UseCase7
Streamlining Due Diligence Processes
Map every due diligence step visually to avoid missing critical approvals or documentation.
#UseCase8
Aligning Stakeholder Communication
Centralize updates and timelines so investors and managers stay informed and engaged.
#UseCase9
Integrating Data Analysis and Reporting
Link financial models and analysis directly to timeline tasks for seamless reporting and adjustments.
Key Beneficiaries
Who Benefits Most from Gantt Chart Software in Asset Management?
Ideal for professionals managing complex projects, multiple assets, and tight deadlines in asset management firms.
If you’re a Portfolio Manager
Visualize investment timelines and coordinate asset lifecycle events across multiple holdings for better returns.

If you’re a Compliance Officer
Track regulatory deadlines, approvals, and reporting schedules to maintain full compliance without last-minute stress.

If you’re an Operations Lead
Coordinate cross-functional teams, manage workflows, and allocate resources with clear task dependencies and milestones.

Step-by-Step Guidance
How ClickUp Gantt Software Streamlines Asset Management
Follow this 6-step approach to transform your asset management projects.
Centralize Project Data
Link financial docs, contracts, and reports directly to timeline tasks for easy access.
Map Project Phases
Visualize acquisition, maintenance, compliance, and disposition stages with clear milestones.
Define Dependencies and Priorities
Set task sequences and priorities to prevent delays and conflicts.
Assign Roles and Deadlines
Ensure accountability by assigning owners and clear completion dates.
Monitor Progress in Real Time
Track status updates and automate alerts to stay ahead of issues.
Review and Adjust Plans
Use insights to optimize workflows and respond quickly to changes.

FAQs on Gantt Chart Software for Asset Management Firms


SOC 2
CERTIFIED

ISO 27001
CERTIFIED

GDPR
COMPLIANT

HIPAA
COMPLIANT